Capturing Value in the U.S. Cement Industry with a Grinding Plant Utilizing Imported Clinker
By Antonio J. Benavides
1. U.S. Cement Market Overview
Cement consumption which is heavily linked to demand from the construction industry has increased worldwide since the 2008 recession. Consumption of cement in the United States has grown to roughly 102 million metric tons in 2019, with cement prices reaching $123.5 per metric ton in the same year (Statista, 2020). This demand was met by cement manufacturing on US soil of approx. 88 million metric tons (86%) and imports of approx. 14 million metric tons (14%).
Figure 1. Annual U.S. Cement Consumption (Expressed in Thousands of Metric Tons)
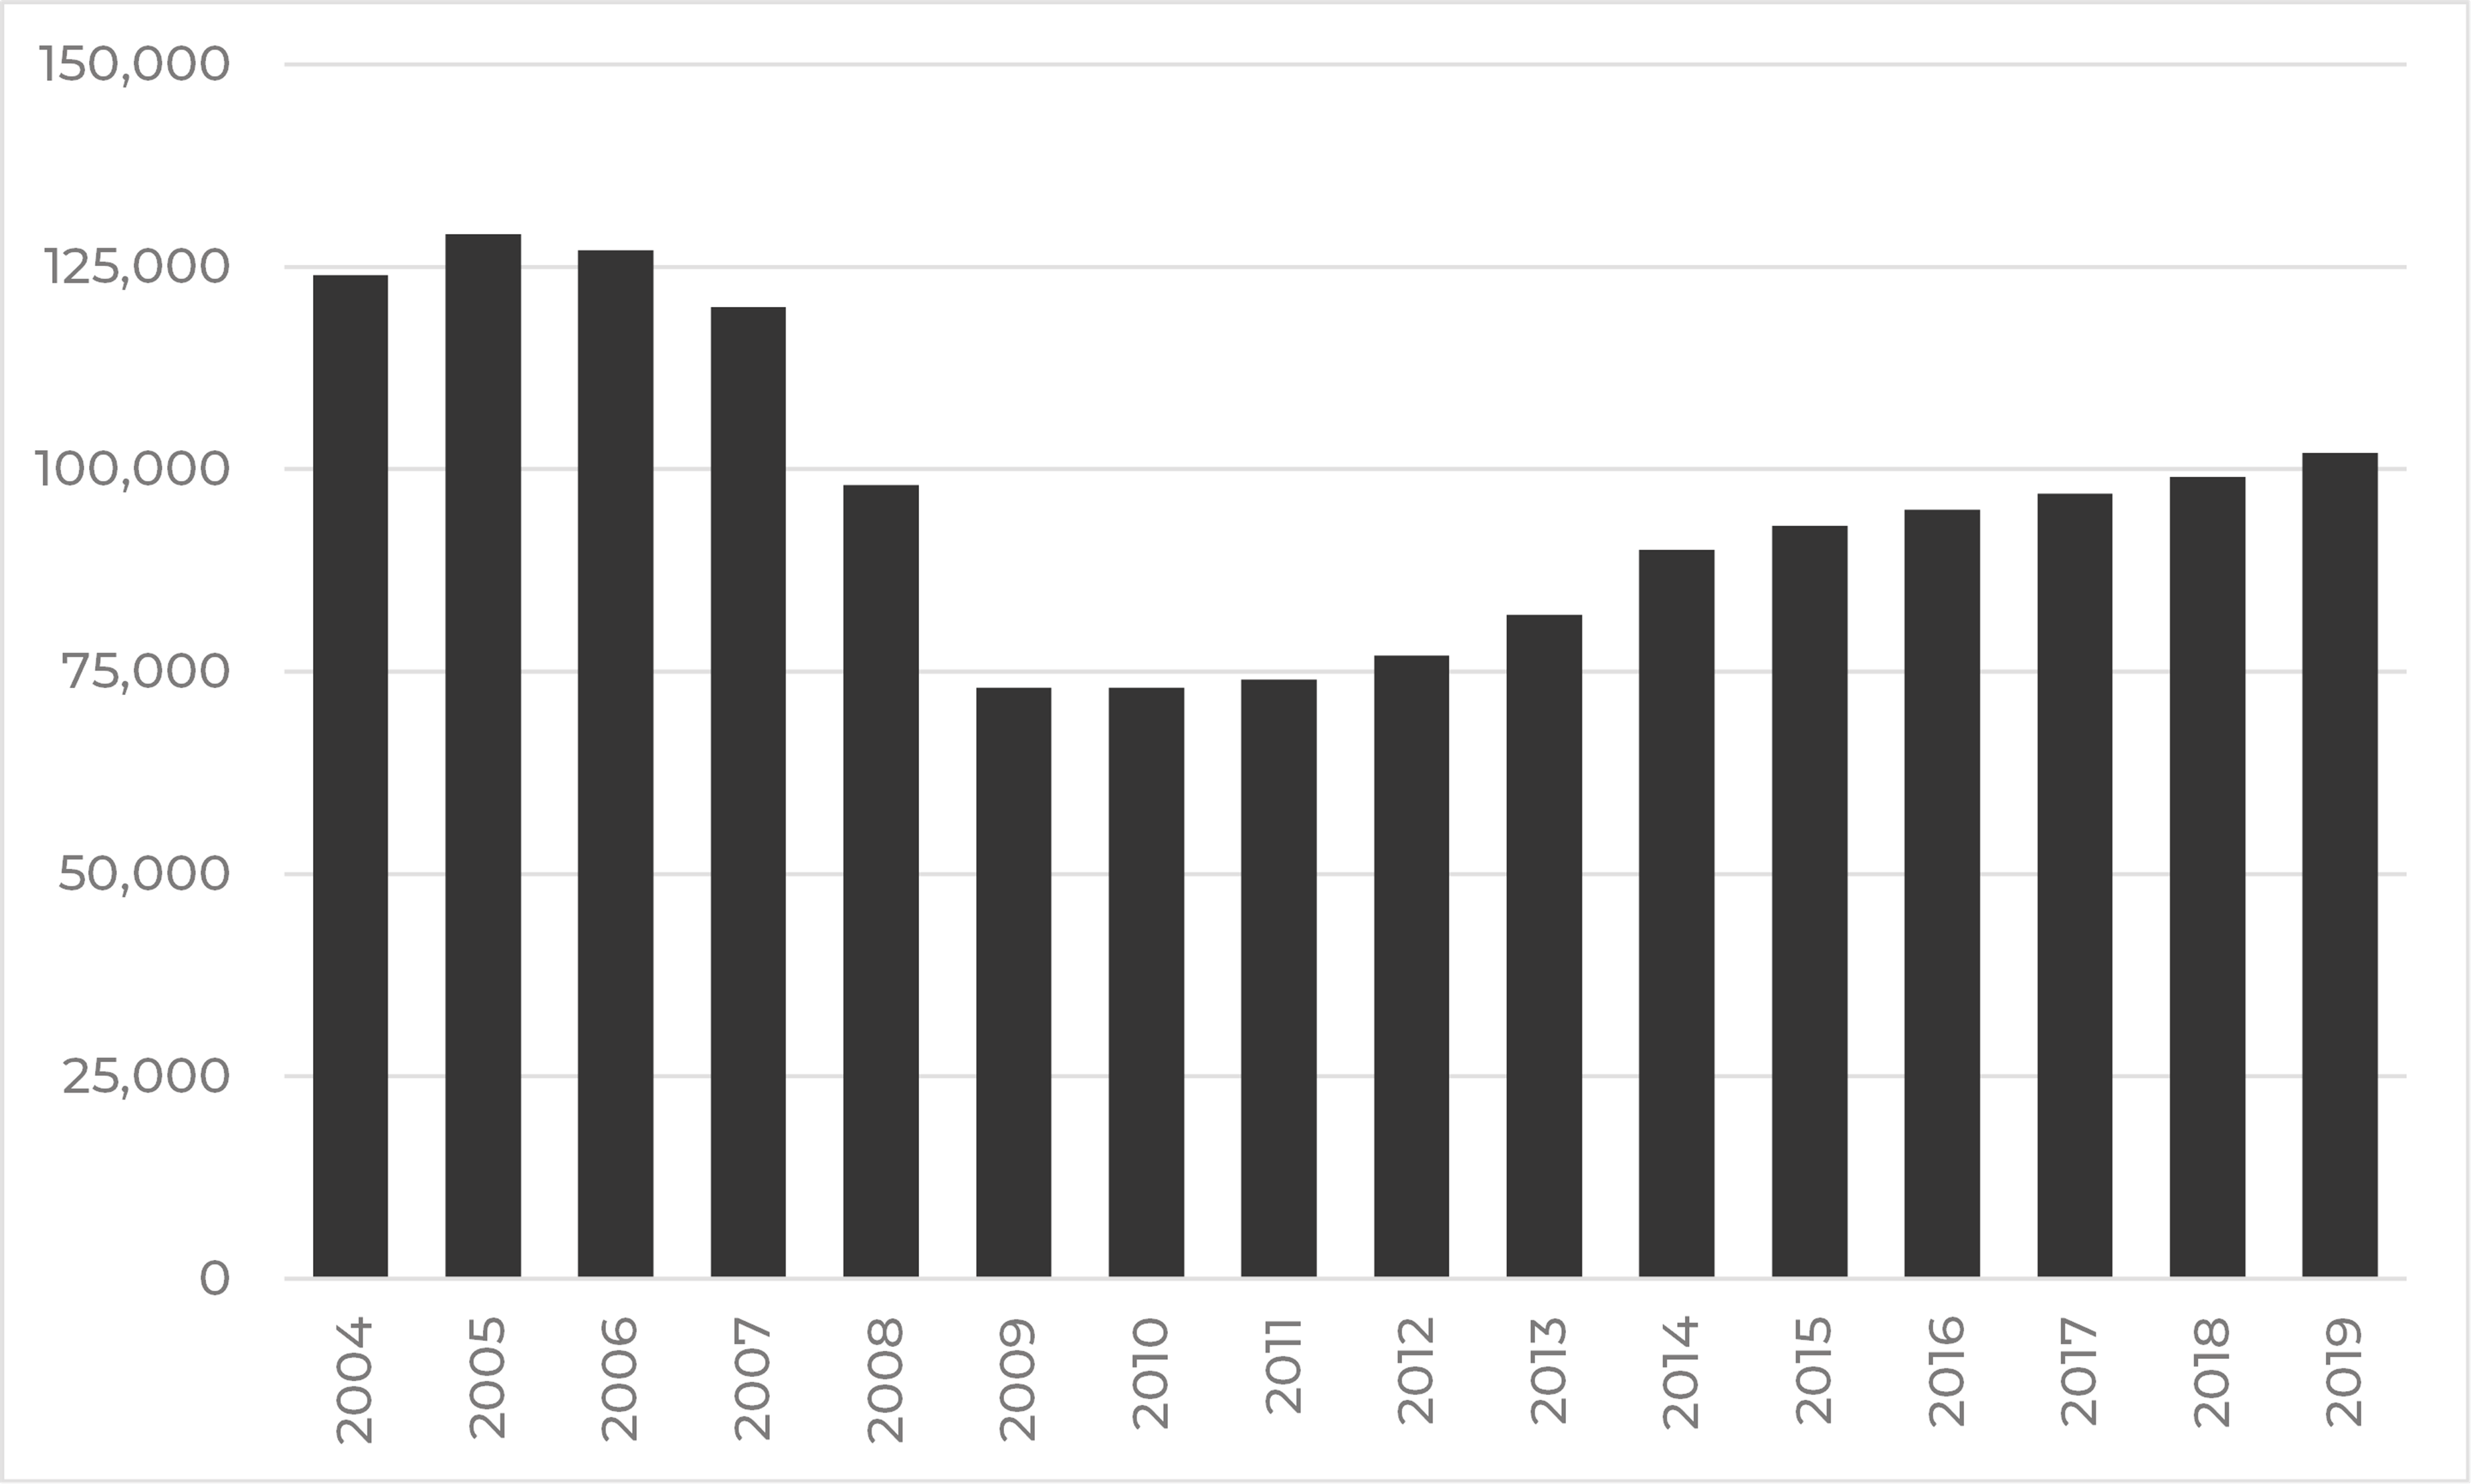
Note. Adapted from Statista (2020).
Cement production has not reached peak levels since the mid-2000s, which could indicate that some cement plants are still idle or there is underutilized capacity at other plants. Disruptions from plant upgrades, closures, as well as inexpensive imports have also led to lower levels of domestic production. In 2019, U.S. Portland cement production was 86 million tons and masonry cement production 2.4 million tons. Cement was produced at 96 plants in 34 States, and at 2 plants in Puerto Rico.
In 2019, sales of cement was valued at $12.5 billion, most of which was used to make concrete, with approximately 70%-75% of sales to ready-mix concrete producers, 10% to concrete product manufactures, 8% to 10% to contractors, and 5% to 12% to other customer types. Texas, California, Missouri, Florida, Alabama, Michigan, and Pennsylvania were, in descending order of production, the seven-leading cement-producing States and accounted for nearly 60% of U.S. production.
Table 1. Key Statistics in U.S. Cement Industry 2015 – 2019
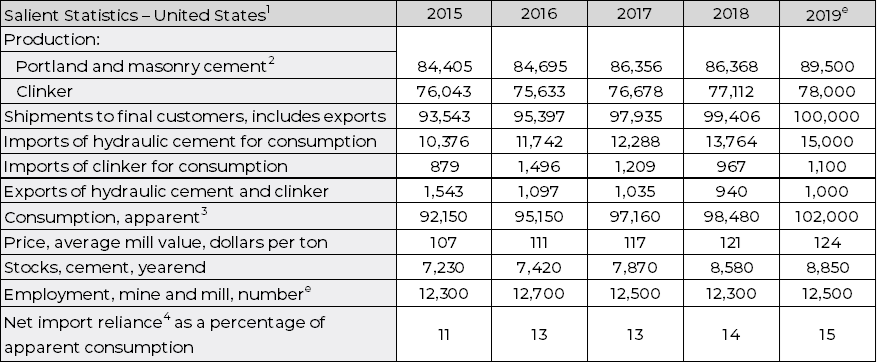
Note. e Estimated. 1Portland plus masonry cement unless otherwise noted; excludes Puerto Rico unless otherwise noted. 2 Includes cement made from imported clinker. 3Defined as production of cement (including from imported clinker) + imports (excluding clinker) – exports + adjustments for stock changes. 4Defined as imports (cement and clinker) – exports. Adapted from the U.S. Geological Survey, Mineral Commodity Summaries (2020).
At present, cement manufacture is one of the most polluting worldwide industrial sectors. Improving the sustainability of the cement industry is an important challenge and is mainly focused on lessening CO2 emissions in the USA. To reduce CO2 emissions, cement manufacturers are increasingly developing alternatives to traditional clinker development: These include 1) clinker replacement by ground granulated blast–furnace slag and fly ash, and 2) the importation of clinker from foreign countries, (José Marcos Ortega, et. al., October 2017).
2. Cement and Clinker Imports to the United States
In 2019, 16.3 million metric tons of cement and clinker were imported into the United States: 13.5 million mts of grey cement, 1.42 million mts of white cement, and 1.38 million mts of clinker. The seaborn part of these imports was 12.0 million metric tons (75%). Compared to the seaborne imports in 2010 of 2.85 million tons, this represents 321% growth.
The overall supply from Asia in 2019 was 2.37 million tons, mainly to the West Coast. The large growth of imports on the US Gulf and East coast has been met from the Europe / Mediterranean region (7.2 million tons, of which 3.9 million tons are from Turkey) and to a lesser degree by Canada and Mexico.
With respect to the clinker imports, 574 thousand tons comes from Canada (across the great lakes), with the remaining 806 thousand tons being imported from Europe. Of note, the clinker imports from Canada across the great lakes go to stand alone grinding plants of the same ownership of the clinker exporter whereas the clinker imports from Europe (with the exception of a small volume of specialty clinker for aluminate cement) are used by US integrated cement plants that are using their surplus grinding capacity to increase their cement production.
Figure 2. U.S. cement and clinker imports 2019

Note. Adapted from Cement Distribution Consultants (2020).
3. The Port Facility as an Economically Efficient Solution for the Cement industry
The long-term export availability of low-priced cement and (especially) clinker, in combination with low shipping prices makes it far more economical to import than to build integrated cement plants in coastal areas. Indeed, it is expected that the new coastal cement production facilities will be grinding plants, with blending capability (Ligthart, Nov.2017).
With US cement plants nearing full capacity, all US cement producers will need import capability to keep market share. Several lack this capability and so will have an interest in new terminal facilities.
Table 2. North American Cement Producers Without Seaborne Import Capability

Note. Adapted from Cement Distribution Consultants (2017).
For those US Cement Producers with seaborne import capability, most of the terminals have ship unloaders that would be able to unload larger vessels, but the average storage capacity is far too low and needs to be expanded or new larger facilities need to be built.
Table 3. Required Storage Capacity by Ship Type and Annual Throughput
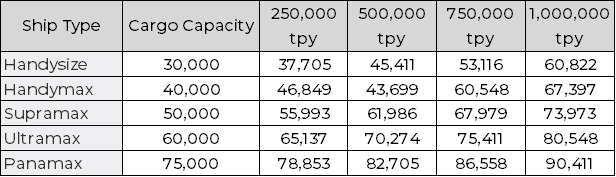
Note. Based on 15 days of buffer capacity and a ship unloading rate of 8,000 tpd. Adapted from Cement Distribution Consultants (2017).
The cost efficiency of shipping by Supramax (or larger ship) versus that of a smaller-sized ship is significant. Current shipping cost from the Mediterranean to US East Coast is about US$ 15-16 per metric ton for Supramax vessels, US$ 18-19 for Handymax vessels and US$ 27-28 for Handysize vessels of around 25.000 Dwt. These shipping costs from a historical viewpoint are very low. Over the lifespan of the terminal´s operation they can be expected to fluctuate with the current cost level as the lower value.
4. Clinker or Cement
Because shipping costs vary over time, it makes more sense not to look at absolute shipping costs and their possible variations but at the relative shipping cost differences between importing cement and importing clinker. When the overall cost of importing clinker and grinding is lower than the cost of importing cement, the grinding plants should be profitable for every perceivable shipping cost. The cost difference between the landed cost of cement and the landed cost of clinker consists of three elements.
-
- The FOB price difference of cement and clinker. Currently this is about US$ 5-6 per metric ton
- The shipping cost difference between cement and clinker varies mostly due to the use of different ship sizes. Current cement imports into US east coast terminals are frequently with Handysize vessels that have an average 35,000-ton shipment size. By utilizing vessels with a cargo capacity of 50.000 tons or larger for clinker imports a current cost difference of US$ 6-8 per metric ton can be realized.
- Terminal costs for cement are significantly higher than for clinker. A difference of US$ 5-7 is currently achievable.
Currently therefore the landed cost of clinker could be about US$ 16-21 per metric ton lower than for cement (US$ 17.45 – US$ 22.90 per short ton). The grinding costs of clinker are smaller than this cost difference. Furthermore, if clinker is imported then several types of cement can be produced from that clinker, allowing greater flexibility to meet the specific and possibly changing local market demands.
Finally, with a grinding plant, additional efficiencies can be obtained by combining the imported clinker with other cheaply sourced materials (e.g., limestone, coal ash, slag, etc.) to make blended / specialty cements. The US is quite particular in its use of Type I/II low alkaline cement. This is a cement with a 95% clinker content and only 5% limestone and gypsum. It is a high-quality cement, but it has a very high CO2 output. The global average is a clinker content of about 83%, and there is a big push to reduce this further.
Globally, the clinker trade is growing much faster than the cement trade. A very large number of new coastal stand-alone grinding plants have been built over the last decade and this trend is continuing. By comparison, relatively few new cement terminals have been built during this timeframe. That the US has somewhat lagged in this respect can largely be attributed to the very high clinker content of its cement. In Africa by contrast, imported clinker comprises only 70% of the cement, with the remaining 30% applying local materials. This is admittedly a lower quality of cement, but it moves the economic advantage of importing clinker and grinding it decisively over importing cement.
In Europe stand-alone grinding plants are often combined with blending capability with cementitious materials resulting in high quality blended cements with a low clinker content. A transition by the US towards cements with a lower clinker content will make importing clinker and grinding it even more economical than the situation at present day.
5. Cement Grinding Plant Project Considerations
Several factors should be analyzed in depth when considering the development of a Greenfield cement grinding plant:
-
- The market: The regional / local market should be evaluated to understand current supply / demand dynamics (including the type of cement in demand), prices, potential medium-term large infrastructure projects.
- Marine logistics: An analysis of marine logistics should include the costs to procure clinker and gypsum, the relative cost of these materials versus that of imported and domestically produced cement, shipping and port expenses, port discharge and storage facility costs / requirements.
- Land logistics: An analysis of the different land transportation options to and from the grinding plant facility, including both highway and rail freight. Also, logistic costs need to be analyzed from the clients’ perspective (distance and convenience of pickup, etc.).
- Location: Possible locations should be evaluated for the grinding plant considering both the market and logistics studies. In is necessary to ensure adequate and efficient access to the market as well as to keep the logistics expenses at a minimum. In some cases, it may be optimal to place the grinding plant adjacent to the port (reducing land logistics expenses), while in other cases it may make more sense for it to be located at some inland location closer to the market.
- Cost of real estate leases: Need to identify the probable costs of lease and confirm the possibility to obtain options on the land. Conceptual design and preliminary engineering:
- At the port: Define the facilities and storage location, the conveying or transport system from ship unloading hopper to storage warehouse, flow diagram and equipment list, preliminary drawings, and obtain budgetary pricing from potential equipment suppliers and construction contractors.
- At the grinding plant (may or may not be at the same location as port facility): Define all the same as in the point above, plus the costs associated with rail transport.
- CapEx, OpEx and economic analysis: Determine the capital expenditures to build the facilities as well as the expenditures to run the operations. As a final step the economics of the projects must be analyzed in depth to confirm the payback timeframe, IRR and NPV of the project. It is highly recommended to perform sensitivity analysis to understand to what degree the different CapEx, OpEx and financing variables impact the cash flow and overall profitability.
- Determine financing options: Depending on the need of external financing to fund the project, a bankable feasibility report should be prepared, putting all the analysis above in a detailed report preceded by an executive summary
References
-
- Ligthart, A., Cement Distribution Consultants, “North American cement and clinker imports – An in-depth analysis”, 2017.
- Ligthart, A., Cement Distribution Consultants, “US cement imports and shipping. A pre pandemic overview and a post pandemic outlook.”
- “The consumption of Cement in the U.S.”, Statista, 2019.
- Mineral Commodity Summaries, U.S. Geological Survey, January 2020.
- Selim, T., Salem, A., Global Cement Industry: Competitive and Institutional Dimensions, June 2010.
- “How cement companies create value: The five elements of a successful commercial strategy”, McKinsey & Company, November 2016.
About the Author(s)
Antonio J. Benavides
Mr. Benavides has over 20 years of experience in banking, consulting, project management, digital transformation, and financial risk management. His expertise includes managing all aspects of consulting projects, from design and planning to execution and reporting. His extensive financial services experience includes financial analysis, integration management, operational & sales transformation and organizational development. He has managed projects throughout the US, Europe and Latin America. Mr. Benavides is a Chartered Financial Analyst (CFA), Financial Risk Manager (FRM), and has an MBA from IESE Business School in Barcelona, Spain.
PEC Consulting Group LLC | PENTA Engineering Corporation | St. Louis, Missouri, USA
How can we help you? Get in touch with our team of experts.