These were the postings that were originally featured on the publications page.

The Effects of Impurities on Lime Quality

By Ken Schweigert

“Lime” is a very general term used to describe virtually all finely divided types of limestone and burned forms of lime. However, by definition, lime is only calcined limestone known as quicklime, calcium oxide, and a secondary product namely hydrated lime (calcium hydroxide) or slaked lime (milk of lime). There are two basic types of limestone – high calcium and high magnesium (dolomitic). The dolomitic quicklimes and hydrated limes correspond to their counterparts in terminology. The only difference is that dolomitic types are a combination of the elements of calcium and magnesium, whereas high calcium limes contain only small percentages of magnesium. Both are produced through calcination at high temperatures. The chemical composition of both lime products is:

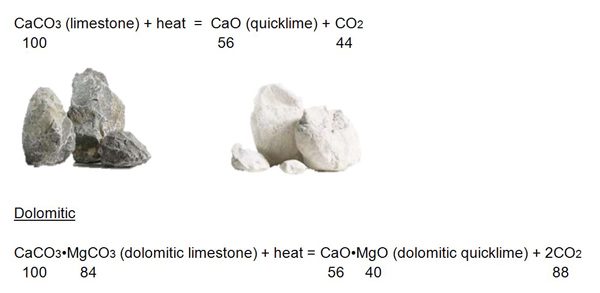
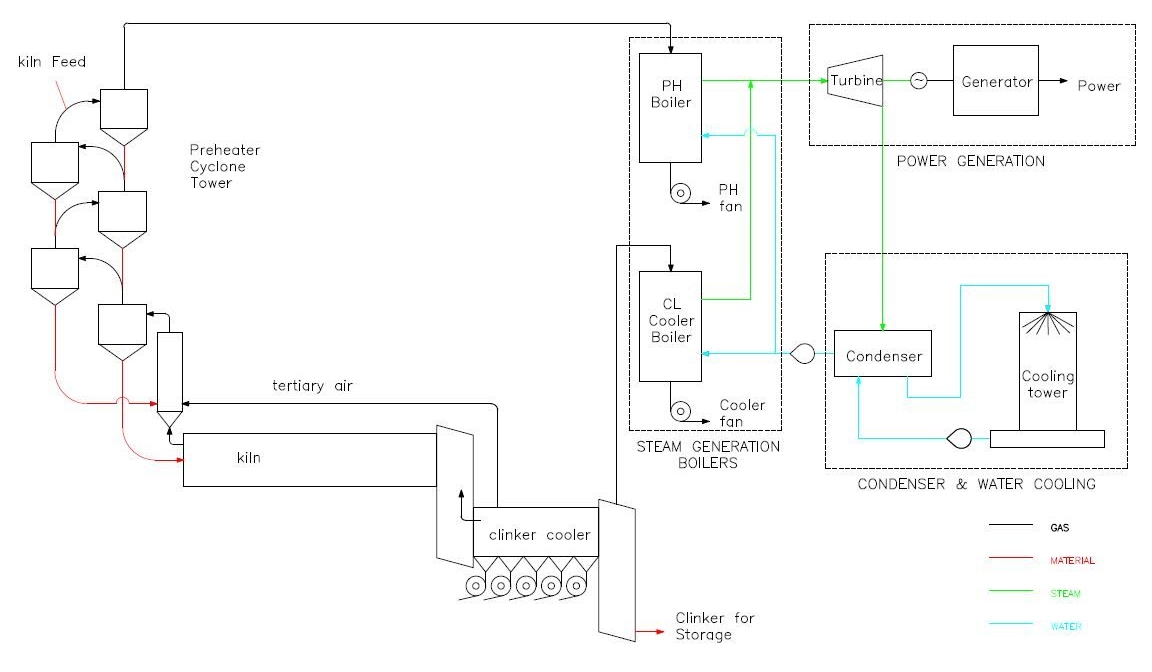
Both of the above reactions are called calcination and occur in furnaces known as kilns. The carbon dioxide content of the stone is expelled as a gas. With pure high calcium limestone, 44% of the stone weight is lost; dolomitic limestone loss is 48%. Both reactions are chemically reversible since quicklime absorbs carbon dioxide readily and, in so doing, transforms itself back to the original carbonate form. Pure dolomitic limestone is about 54.5% CaCO3 and 46.5% MgCO3

Note: Other sources of CaCO3 other than limestone can be seashells, corals, and other naturally occurring deposits of chemical by-products. 

Quicklime has a natural affinity for moisture and carbon dioxide. Therefore, it is perishable. Consequently, it must be stored in dry, moisture-proof areas that are also free from CO2. A more stable form of lime is hydrated lime, which is produced in a hydrator where just the right amount of water combines with the quicklime to produce a fine dry white powder. 

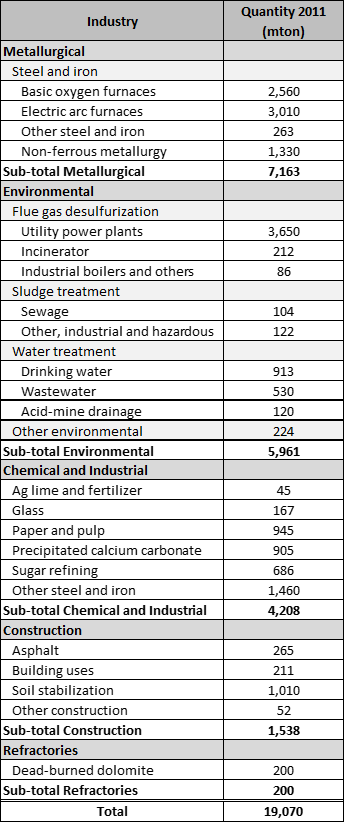
The purity of the lime is influenced largely by the quality of the limestone and, secondly, by the manufacture. The chief impurities are silica, alumina, iron and for high calcium lime, magnesium. There are other trace elements that can be a problem for some quicklime customers: sulfur, phosphorus, arsenic, manganese and fluorine. In special applications these trace elements have strict tolerances on the amounts of these impurities: e.g., for calcium carbide manufacture – phosphorus; for steel manufacture – sulfur; for baking powder and food manufacture – arsenic and fluorine; for glass manufacture – iron.

Magnesium Oxide (MgO) is a problem in high calcium lime as it affects the reactivity of the lime. The dissociation temperatures (temperature when CO2 is driven off) for high calcium oxide is about 898°C, while magnesium oxide is about 760°C. This makes the magnesium oxide “hard burned” and therefore, slow slaking and less active. In most applications, other than steel manufacture, MgO is not desirable. 

The majority of customers for quicklime purchase lime for two main requirements – available lime and reactivity. For available lime (CaO), generally one can calculate the impurities (other than MgO) as double quantitatively during calcination since 44% of the weight of the stone is carbon dioxide which is lost during calcination. Added to this is the loss of lime which combines with these impurities. Also, the amount of non-calcined limestone residue, known as “core”, has the same effect since it is not available. 

Reactivity is affected by the impurities, the amount of MgO, and the amount of core or unburned limestone. However, reactivity is also affected by burning the quicklime too hard. This has the effect of reducing the core, but can make the lime very slow to react in water. Lime producers have learned to keep the amount of core to a minimum while maintaining a highly reactive lime.

In summary, the quality of quicklime is affected both by the impurities in the limestone and the degree of burning in the lime kiln. Both are important in the production of high quality lime.  

About the Author(s)

Ken Schweigert

PEC’s expert for the non-metallic minerals industries; he has many years of experience in mining and processing of lime, cement, calcium carbonates, aggregates, silica sand, diatomaceous earth, perlite and clays. His expertise includes plant design, selection of process equipment, project scope development, operations improvement, maintenance, plant personnel and equipment evaluations; due diligence analysis and construction services. Mr. Schweigert has a BS in Engineering Management from Missouri University of Science & Technology.


PEC Consulting Group LLC | PENTA Engineering Corporation | St. Louis, Missouri, USA

How can we help you? Get in touch with our team of experts.


Project Visualization/Rendering

For as long as engineers have been designing plants, there has been a “disconnect” between what engineers visualize and others perceive. Engineers have the ability to read 2D drawings and visualize the project in 3D. However, it is very difficult to convey the vision of the final product to those who do not have this aptitude. Audiences are often composed of financial and management decision makers with little experience in plant design. In many cases, engineers find it difficult to communicate a design without some form of visual aid.

Figure-1-Project-Visualization-Rendering

Figure 1- Project Visualization/Rendering

Visual aids are also necessary to improve communications with the public during the environmental permitting process. As soon as a company announces an expansion or new facility, public meetings are required to address the concerns of area residents. Unfortunately, the public attending these forums many times comes with a negative perception relating to the intent of the company and the detriments that the project may bring to the community.Fear of the unknown makes it difficult to sell the project to the public. The Owner has to be prepared to answer questions during public meetings and communicate the design of the new plant and its attributes in a form which is easily understood by the public. How is this facility going to look like from my house? Is it visible from the highway? They envision tall stacks and large structures. Visual aids are very useful in such cases where there is demand for clear communication.

Figure-2-Visualization-of-a-Terminal-1

Figure 2 – Visualization of a Terminal

Architects have known for years that providing 3D renderings to their clients before final design is essential to explaining their projects. When a client sees his house or building in 3D, he can communicate what he likes and dislikes in the design. Architects found 3D renderings and models a very valuable tool for feedback and improvement in the overall satisfaction of their clients.

Figure-3-Visualization-of-a-Clinker-Cooler-in-a-cement-plant

Figure 3 – Visualization of a Clinker Cooler in a cement plant

PEC Consulting has the capability of providing this service to its clients. Renderings can be produced to show the project in 3D from many different views. Views can be created to show the visibility of the site from locations such as a neighbor’s home or the view from a vehicle passing the plant. The plant site can be super-imposed on a topographical map or Google Earth to show the plant in the area where it will be located. Views can be shown simulating either daytime or nighttime to show the plant at different times from different vantage points.

Figure-4-Nighttime-Rendering-of-the-Plant

Figure 4 – Nighttime Rendering of the Plant

Now the Consultant has a means to better communicate the design of the plant; the placement on the site; and, how it fits in relation to the community around the plant. Decision makers and residents are able to make informed decisions about the future of the proposed design. In some cases, renderings can make the difference between a project going forward or not. It is another tool for new projects where the need to “visualize” the end product is very important.


The main contributor to this feature article is Ken Schweigert, PEC’s expert for the non-metallic minerals industries; he has many years of experience in mining and processing of lime, cement, calcium carbonates, aggregates, silica sand, diatomaceous earth, perlite and clays. His expertise includes plant design, selection of process equipment, project scope development, operations improvement, maintenance, plant personnel and equipment evaluations; due diligence analysis and construction services. Mr. Schweigert has a BS in Engineering Management from Missouri University of Science & Technology.

View additional feature articles under PublicationsContact Us


Project Execution Strategy

EPC, EPCM, or Owner Managed — Which is the best path for your next project?

The Project Execution Strategy should be decided early in the planning process, preferably during the Feasibility Study. More specifically, the “best fit” approach should be apparent sometime between identifying a baseline scope and schedule. In most cases, the Feasibility Study will contain enough information for the project sponsor to finalize recommendations to management on which Execution Strategy best fits the project.

There are specific conditions and determining factors that will help you decide which approach best suits your project. The most critical items to consider when selecting the execution approach are shown in Figure 1.

Project Execution Strategy - fig 1

Engineering, Procurement, and Construction (EPC)

The selection of the EPC Contractor generally results when the Owner wants limited risk and is prepared to pay a higher price for a fixed budget. This approach is recommended for several reasons, but mostly if the Owner lacks the experience and resources (skilled project staff) to effectively manage the project.

Benefits of choosing the EPC approach include:

  • Reduced Owner Risk
  • Fixed Schedule with delivery date
  • Fixed Budget (less change orders)
  • Single Source for Performance Guarantee

Negatives of the EPC Approach can include:

  • High premium
  • Longer bidding process
  • Limited control over details
  • Change Orders arising from additional scope

With the EPC approach, before signing of the contract, it is paramount that the Owner spells out as much detail as possible within the scope of work. A poorly detailed scope will most certainly result in change orders or poor quality. Because this is to be avoided, it is especially important that the Owner’s project manager resist pressures to fast track the bidding process. Most of the Owner’s risk can be eliminated in this single contract, so it is important that it is as detailed as possible. Unfortunately in some cases, certain details cannot practically be obtained prior to the Contract; this is a common occurrence in complex projects that require lots of interfacing with existing facilities. In those cases, be sure that you are carrying sufficient contingency on the conservative side.

The Organization for the EPC Approach can be seen in Fig. 2

Project Execution Strategy - fig 2

Engineering, Procurement, Construction, and Management (EPCM)

The EPCM approach allows the Owner to maintain more control over the project’s Scope and Schedule, while the EPCM contractor serves and acts on the Owner’s behalf. The role of the EPCM contractor is to provide the Owner with engineering, procurement assistance, construction supervision and management.

The extent of services provided by the EPCM contractor is dependent on the capabilities of the Owner’s staff; however, typically the EPCM contractor will be responsible for:

  • Design and Engineering work
  • Providing documentation and expertise for the permitting process
  • Negotiations with vendors and contractors, and recommendations to Owner
  • Issuing Purchase Orders and contracts on behalf of the Owner (dependent on Owner’s desire)
  • Monitoring and controlling project vendors and contractors during procurement and construction

The Owner will provide:

  • Overall control (staff a Project Management Team)
  • Approval of the selection of vendors and contractors
  • Issue contracts and purchase orders (unless delegated to EPCM)
  • Acquire permits and approvals

Benefits of the EPCM approach include:

  • Maintain overall control of the Project
  • No mark-up due to Contract Risk
  • Competitive pricing, advantages remain with Owner

Negatives of the EPCM approach include:

  • Owner has most of the risk
  • Increased Owner effort required
  • Potential for Gaps in Scope Coverage between Contractor and Vendors

The Organization for the EPC Approach can be seen in Fig. 3

Project Execution Strategy - fig 3

Owner Managed Project

With Owner Managed Project, the Owner is fully committing to manage all aspects of the project. This approach has the potential for the greatest cost saving, but only if the Owner has the resources and experience for the complexity and size of the project. Again, if a feasibility study is performed in the early stages of the project, the project sponsor should be able to make a recommendation on whether this approach is viable.

Benefits of the Owner managed approach include:

  • Absolute Control over project
  • Direct Oversight over Engineering & Design
  • Competitive Pricing, advantages remain with Owner
  • Potential for Cost Savings and fast-tracking

Negatives for the Owner managed approach include:

  • Owner has all the Risk
  • Increased Owner Effort Required
  • Potential for Gaps in Scope Coverage
  • Potential for Gaps in Design & Engineering
  • Need for Temporary or reallocation of Resources
  • Increase Demand on Departmental Staff
  • Potential for Cost Overruns

The Organization for the Owner Managed Approach can be seen in Fig. 4

Project Execution Strategy - fig 4

Summary

Selecting the Project Execution Strategy is ultimately dependent on the Owner’s risk tolerance and Project Management capabilities, desired level of involvement and control, and budget constraints.


The main contributor to this article was Christian Benavides, Construction Technical Consultant at PEC Consulting Group.

View additional feature articles under PublicationsContact Us


Essential Study Phases to Determine Project Feasibility

A project life cycle has several phases: Conceptual, Pre-feasibility, Feasibility, Financing, Engineering, Construction, Commissioning and Start up. In this article, we will focus on the first three phases which are essential to determine the project’s viability and to the successful outcome of the project’s implementation.

Project development phases should be followed in a certain order of coverage and extent to make necessary determinations before proceeding to the next more advanced phase. No tasks within a phase should be skipped or missed, and a phase should not be shifted to the next level until it is completely defined. The intent is to advance the project following a systematic course of action, starting with Phase 1, and within the steps and activities of each one of the phases. All along, there has to be a high level of commitment on the part of the Owner/Investor to follow the process in order to ensure the project’s viability in a realistic and objective way.

The evaluation of a potential project starts with an analysis and research of the existing information on the project. This initial conceptual work will support the next phases. During each progressive phase, the study will focus on more extensive investigation of the raw materials resources, market, infrastructure, community, and general project economics. The final phase will be completed when a level of certainty of the project’s viability can be determined at an acceptable risk level. The activities of each phase are summarized below.

essential-phases-feasibility-study-fig-3

PHASE 1 — CONCEPTUAL STUDY (ALSO CALLED “SCOPING STUDY”)

During this phase, the project is conceptualized based on the needs of the Owner. The Owner must appoint a single source of contact for the project with appropriate authority. The Owner’s Management Team must choose a qualified and experienced Consulting Company with the qualifications necessary to provide credibility on the findings and conclusions of the study. The following activities take place during Phase 1 – Conceptual Study:

  1. Analysis of the geology of each of the areas of interest and how they relate to potential mining operations.
    • Raw materials resources of ample supply and quality must be identified by the initial geological survey.
  2. A market study to determine the processing capacities and help in the analysis of the economic viability of the projects.
    • The market analysis will determine the size of production plant which would be economical within the area of influence.
  3. Permits must be considered along with any limitations that are likely based on local regulations.
    • This will form the basis of the preliminary Environmental Impact Assessment (EIA).
  4. Development of mining and processing plant concepts with corresponding CapEx, OpEx, and an Economic Analysis.
  5. The Conceptual design must be performed taking into consideration:
    • Plot Plan (plant layout at its physical location).
    • Logistics (access to and from the facility).
    • Infrastructure (utilities, natural gas, coal, process water, access).
    • Block Flow Diagram (graphical representation of the plant process).
    • CapEx (the plant’s cost – developed from references).
    • OpEx (the plant operating costs – developed based on the location).
    • Risk Analysis (outline of major risks and strategy).
    • Definition of Environmental Standards and all permitting requirements.
    • Preliminary Project Schedule.

The Conceptual Feasibility Study Report will provide a preliminary insight into the economic feasibility of the project.

PHASE 2 – PRELIMINARY (“PRE”) FEASIBILITY STUDY

The Pre-Feasibility Study is a more comprehensive study that determines the technical and economic viability of a mineral project. This phase refines the project as follows:

      1. Geological Exploration Program
        • Extensive drilling and laboratory testing will be carried out as specified in the Conceptual Study Deliverables which will determine probable reserves of raw materials.

essential-phases-feasibility-study-fig-1

Figure 1 – Full geological evaluation means detailed geological mapping based on core samples, and ultimately developing an economical mining plan

    1. Plant Site
      • The site location and plant layouts are finalized.

essential-phases-feasibility-study-fig-2

Figure 2 – Selected Site

  1. Market Analysis
    • Further definition is given to projected sales for the eventual production.
  2. Technical Aspects
    • Raw material adequacy assessment and calculations.
    • Process evaluation of competing technologies.
    • Project Design Criteria.
  3. Economic and Financial
    • CapEx (plants costs are developed from budgetary vendor information).
    • OpEx (operating costs are developed from refined location and plant design criteria).
    • Economic Analysis.
    • Market trends and future growth potential analysis.
  4. Organizational
    • Assessment of support systems.
    • Recommendations for functionality and efficiency improvements.
  5. Environmental and Social
    • Environmental and regulatory compliance system development.
    • Operating permit review (Federal, state and local agencies).
    • Permits applications for all permits are filed.
    • Public Relations consultant finalizes the assessment of social issues and a program to be implemented.
  6. Engineering analysis
    • Plot Plan (defines the materials handling and process flow).
    • Logistics (access to and from the facility is further refined).
    • Equipment (an equipment list specific to quarry and plant is developed).
    • Block Flow Diagram (the graphical plant process is refined).
    • Risk Analysis (major risks are outlined).
    • Strategy (the overall plant strategy is developed with a view to moving the project forward).
    • Schedule (the Project Schedule is refined based on the changes and developments of the pre-feasibility study).

The Pre-Feasibility Study Report indicates if the project looks promising and has an attractive payback. The quarry and plant sites are now known, located in an area convenient in relation to the raw materials source and good logistics to the market. It will point out areas that need to be further refined.

Figure 1 shows a site where the ore geology is promising, as well as a good location for transportation and reasonable mining costs.

PHASE 3 – FEASIBILITY STUDY (ALSO CALLED “BANKABLE FEASIBILITY STUDY” AND “DEFINITIVE FEASIBILITY STUDY”)

A Feasibility Study will provide the information on the minerals reserves, infrastructure, and process designs which will serve as a basis for an investment decision and the support for project financing. During this phase, the development of the project reaches a high level of confidence.

The activities taking place during a Feasibility Study are as follows:

  1. Raw materials
    • Mining plan to determine proven reserves.
  2. Plant Site
    • The plant site location is refined.
  3. Market Analysis
    • Final Market Study Report.
  4. Technical Aspects
    • Process design to meet emissions standards.
    • Fuel sources.
    • Equipment List (Owner’s preferred equipment for upcoming firm equipment quotations)
  5. Construction Strategy
    • Extent of the Owner’s participation is discussed. This raises further questions such as: will the savings of an EPCM project prevail, or will the project pay for passing the risk to a design-build contractor? Should the equipment supply be Owner purchased, and the construction design-build?
  6. Economic and Financial
    • Integration of the technical and financial phases of the project The CapEx, OpEx and the logistics into the economic model for a realistic projection of the financials
  7. Environmental and Social
    • Finalize filing of all necessary permit applications
    • Finalize assessment of social issues
  8. Engineering Analysis
    • Plot Plan (materials handling is developed and the plot plan revised accordingly)
    • Logistics (all aspects of transportation and materials handling are valued)
    • Equipment list (the equipment list is refined)
    • Preliminary civil, structural, mechanical and electrical design is established
    • Detailed Geotechnical Study
    • Final Block Flow Diagram
    • Equipment Bid Package(s) are issued, comprising:
      • Design Criteria
      • Equipment Specs
      • Process Flow diagrams
      • Electrical and Automation specifications
      • Terms and Conditions
    • Short list of construction companies. A Bill of Quantities is issued to obtain budgetary offers
    • CapEx (update based on firm equipment pricing and budgetary contractor pricing)
    • OpEx (update based on equipment selection and fuel and electrical budgetary quotes)
    • Economic Analysis
    • Risk Analysis (risk strategy is implemented in conjunction with each item in the CapEx, OpEx, and Market)
    • Strategy (strategy to move the project to completion)
    • Schedule (the Project Schedule is established based on strategy).
  9. Process Equipment Bidding
    • The Owner provides materials samples for the process equipment bidders. The equipment bidder does the laboratory testing and provides confident performance guarantees that will meet all the necessary emissions standards.
    • During the Feasibility stage, equipment bidders should have been able to respond to an RFQ in 12 weeks. The engineer’s technical bid evaluation period will depend on the number of bidders. Typically there is a period of clarification, checking and validation before the vendors are short-listed.

The Feasibility Study Report provides the Economic model required by the bank / external sources of finance. It provides professional financial projections and addresses the needs of investors and lenders.

The following Figure is a table with a summary of Feasibility Study activites.

essential-phases-feasibility-study-fig-4-table

The main contributor to this feature article was Rita Merz, Business Development Manager at PEC Consulting Group.

View additional feature articles under PublicationsContact Us

Qualitative Aspects of Project Risk Management

By Lucia Martinez

Mineral Industry projects are subject to high risk because of their size, complexity, and high cost.

The opportunity to manage risk decreases as the project life cycle progresses. Therefore, it is essential to timely plan and perform effective risk management starting at the onset of the project.

During the feasibility analysis and design stages, a thorough analysis of the different characteristics and project objectives should be carried out for the benefit of all interested parties. The applicability and accuracy of the assumptions made at this stage should be the basis for decision-making by the Stake Holders and must be re-analyzed at later stages of the project. Therefore, it is essential that these assumptions are based on a process of proper risk management.

Furthermore, it is during these early design stages that the project’s viability will be determined. If findings indicate that it may not be possible to comply with technical, financial and other key requirements, the project should be re-analyzed for a different set of conditions or possibly abandoned.

In order to properly evaluate project risks, one must consider both the probability of risk occurrence and the impact on the project objectives once the risk event occurs. This is best achieved by plotting the risks on the ‘probability-impact’ matrix.

Figure 1. Probability-Impact Matrix

In the matrix, the x-axis represents the probability value, while the y-axis represents the impact value.

The matrix consists of four quadrants: A, B, C, and D.

Quadrant A represents the risk with high impact and high probability of occurrence. The project team must implement an action plan to mitigate these risks.

Quadrant B represents the risk with high probability and low impact. These risks are most likely to occur. Thus, risks in quadrant B should be included in the risk mitigation plan.

Risks in Quadrant C have a low probability but will severely affect the project. The typical examples are external risks such as negative environmental impact and changes to laws and regulations that affect the project economics. Furthermore, risks such as design flaws, construction accidents or errors have a high impact on a project’s duration and cost. Certain risks in this quadrant can be managed by insurance.

Risks in Quadrant D have the lowest probability and lowest impact on project failure. These risks are usually ignored.

The chart below illustrates the standard path of the process for a Minerals industry project.

Figure 2. Risk Assessment Process Map

Mineral Mining and processing projects are subject to risks of various natures.

Risk factors in order of importance are:

    1. Raw Materials.
    2. Market.
    3. Local Political and Social Conditions.
    4. Environmental Regulations and Permitting.
    5. Capital Investment Variations.
    6. Operating Costs Variations.
    7. Financing.
    8. Infrastructure.
    9. Project Schedule.

Once the project risk factor have been identified, the next step is to identify the specific risks that may result from each of the risk factors.

In a project, Risk is defined as an event or condition that, if it occurs, has a negative effect on project objectives. Negative risks affect project objectives, such as:

    • Higher project costs.
    • Delays in the Project Schedule.
    • Lower Quality.
    • Environmental Impact.
    • Conflict with Local Communities.
    • Loss or Damage to People or Property.

Studying in detail the nature of a risk is a good way to create a risk prevention plan.

1. Raw Materials

In order of importance, the availability and quality of raw materials have the highest level of potential risk (Quadrant A). Without proper available raw materials, the project is condemned to failure. There are guidelines that set the parameters to minimize this risk, such as:

    • Drilling Plan. Drilling sampling and testing help verify that there are sufficient minable raw materials to support the project life.
    • Chemistry & Physical Properties. Samples of each drill hole are analyzed to verify the quality of raw materials throughout the depth of the mineral resource.
    • The Reserves Information and the Mining Plan are very important to prove the economics of exploitation.

2. Market

The market represents an important risk (Quadrant A). A good Market Study should cover:

    • Projected Sales volume by product.
    • Quality.
    • Economic Stability.
    • Infrastructure.
    • Logistics.
    • Economic Framework growth.
    • Competition.

3. Political and Social Conditions

The study of these risks should be done by a specialized firm. The risk involved could be very high (Quadrant C).

    • Long-term Political stability to allow full ROI.
    • History of social unrest.
    • Acceptance of mine and plant by neighboring communities.
    • Effect of road traffic on local population.
    • Investment that may be necessary to mitigate risk.

4. Environmental Regulations and Permitting

One of the major causes of project delays is in obtaining governmental permits. In fact, many projects never materialize due to permitting issues (Quadrant C).

It is very critical therefore to do a thorough due diligence on the regulations applying to the project property during the early stages of project development. For this purpose, either the Owner or the Consulting firm responsible for the Feasibility Study should retain an environmental consulting firm who is familiar with both the local regulations and the agencies responsible for issuing the permits. In most cases, environmental permits are tied to local social issues, so combining the environmental and social due diligence is advisable.

5. Capital Investment

The economics of a project are highly dependent on the total capital cost estimate (Quadrant C). The investment cost in turn is dependent on many factors which must be carefully controlled and monitored. A well-prepared and comprehensive Feasibility Study carried out by a specialized competent firm is the key to an accurate estimate on which the Board of Directors can rely when approving the budget for the project.

The following are key factors for a good estimate:

    • A detailed scope of all the components that make up the project
    • Price quotes from equipment suppliers
    • Budgetary quotes from construction contractors
    • Sufficient engineering to do a thorough capital cost estimate
    • A project management program with strict budget and schedule controls to complete the project on budget and on-time.

6. Operating Costs

The basic cash flow of a project is the product sales minus the operating costs (OPEX) and taxes. Making an accurate OpEx estimate is therefore critical to assessing the success of a project (Quadrant D).

Critical OpEx factors are:

    • Labor
    • Fuel
    • Electric Power
    • Consumables
    • Maintenance
    • Supply Chain Logistics
    • Logistics of product to supply the market
    • A competent firm with a high level of industry experience can make a good OpEx estimate for a site specific project.

7. Financing

Is the project financeable, and on what terms? Very few projects can be executed without financing; therefore, this is one project aspects that must be investigated from the very conceptual stages of project development.

Financing organizations will do their own due diligence of projects which will require significant financing values. A well prepared and thorough Feasibility Study will facilitate the financing organizations due diligence and expedite the financing process.

If the project economics are attractive the risk factor will fall in Quadrant D. But if the location of the project lacks political or social stability, then the risk factor will fall in Quadrant A.

8. Infrastructure

The lack of proper infrastructure will imply costs which may be significant in relation to the capital investment of the mineral processing facility (Quadrant C).

Availability and reliability of the following must be considered:

    • Electric Power.
    • Water Supply.
    • Logistics/accessibility for the supply of consumables and product dispatch.

9. Project Schedule

A risk that is always present in every project is delays caused by unforeseeable events, such as the delays of a permit to start building or in the delivery of materials which prevent starting an activity.

The delay may have a high probability occurrence, but a low impact on the project failure (Quadrant B).

It is important that in the early stages the project management design a realistic schedule for the project that should be continuously updated in order to avoid delays as much as possible.

About the Author(s)

This article was contributed by Lucia Martínez, Research Assistant at PEC Consulting Group.


PEC Consulting Group LLC | PENTA Engineering Corporation | St. Louis, Missouri, USA

How can we help you? Get in touch with our team of experts.

Sensitivity Analysis for Mineral Processing Projects

By Jorge L. Lerena

The Economic Feasibility or “Economic Attractiveness” of a Project is determined by economic indicators such as the Project’s Payback Time, Internal Rate of Return (IRR), or Net Present Value (NPV).

These indicators are the result of an Economic Analysis which was based on estimated Project Capital Expenditures (CAPEX), Operating Expenditures (OPEX), and Market Price among other variables.

This brings the following questions:

    • How is the Project’s Economic Attractiveness affected by variations in the Project’s CAPEX or OPEX?
    • Under which scenarios is the project not economically attractive?
    • Which are the key factors to keep track during the project development?

The following Case Study is used to demonstrate a project’s susceptibility to input variables:

    • Project: Greenfield Cement Plant (X, tons per year capacity, Y USD/ t Market Price).
    • Project Stage: Prefeasibility Study.
    • Project CAPEX: USD 450 Million.
    • Project OPEX: USD 53 / ton of Cement.

For the above scenario, the Economic Model would show the following financial indicators which present the project as economically attractive:

    • Pay Simple Back: 6 years.
    • Project Stage: Prefeasibility Study.
    • Project IRR: 16%.
    • Project NPV: USD 177 Million.

In another scenario, what happens if the Project CAPEX exceeds the budget by 20% and the estimated OPEX Cost is underestimated by 15%? Is the project still attractive?

The following analysis shows the sensitivity of Payback Time, IRR and NPV based on variations of + 20% in the Project’s estimated CAPEX and/or OPEX.

Table 1. Sensitivity of Payback Time, IRR, and NPV

Note. Based on variations of + 20% in the Project’s estimated CAPEX and/or OPEX.

From the above, it can be easily seen how variations in OPEX and CAPEX affect project economic indicators.

This Sensitivity Analysis can also be generated for other variables such as price, interest rate, inflation, and others which may be of concern in a project.

A Sensitivity Analysis can be used to account for other variables, such as:

    • Sensitivity of OPEX from fluctuation in fuel costs (or labor, electricity costs, etc.).
    • Sensitivity of CAPEX from fluctuation in steel costs (or concrete costs, number of piles, etc.).
    • Sensitivity of Payback from fluctuation in annual sales.

A Sensitivity Analysis allows investors to assess risk.

Figure 1. Project Construction

PEC Consulting is experienced in developing Economic & Sensitivity Analysis Models and recommends actions at every stage of Project Development: Conceptual, Prefeasibility, Feasibility, and project execution to minimize risks. Our services include:

About the Author(s)

This article was contributed by Jorge L. Lerena, Consultant and Project Manager at PEC Consulting Group. His expertise includes financial and economic evaluation of industrial facilities. He has participated internationally in Brownfield and Greenfield mineral processing plant projects.


PEC Consulting Group LLC | PENTA Engineering Corporation | St. Louis, Missouri, USA

How can we help you? Get in touch with our team of experts.


Homogenization Strategy in the Cement Industry

Cement clinkering process quality assurance demands specific chemistry and consistency of the kiln feed for a stable operation. This brings to focus the importance of the Blending and Homogenizing process. The proper choice of equipment and operating strategy play an equally important role promoting homogenization.

Limestone is the most important raw material in the manufacture of cement as it provides the main ingredient CaO. It is blended with other raw materials such as clay, marl, shale and corrective additives to prepare a mix with the four main ingredients, CaO, SiO2, Al2O3 and Fe2O3 in the correct proportion. Although these ingredients are present in all the raw materials, they occur in different proportions. Based on their individual chemical composition, they are blended in specific ratios to achieve the target chemistry.

However, each material comes with its own chemical variations. Even if the mix meets the target average chemistry, the required consistency is achieved by the blending and homogenizing process.

The entire material handling system starting with the receipt of raw materials to the kiln feed is designed to achieve the desired level of homogeneity. Even though the receiving hoppers and transfer towers achieve this to some extent, our major focus is on systems specially designed for blending and homogenization:

  • Pre-Blending Stockpile (Stacker/Reclaimer)
  • Mill feed bins and weigh feeders and
  • Homogenizing Silo

Let us say there are five different raw materials, A, B, C, D and E. According to the blending strategy, let us assume A, B and C are proportioned and blended in the Pre-Blending Stockpile; D and E are lower volume components added through the Mill Feed Bins. All the five components are pulverized in the mill and homogenized in the Homogenizing Silo.

Pre-Blending Stockpile

The Pre-Blending Stockpile is sometimes used as a single-component homogenizing system or to mix and homogenize several components. In this case, A, B and C are proportionally fed and blended in the Pre-Blending Stockpile. Even the best blending system needs a clear strategy for blending and homogenizing, especially for a multi-component system as in this example. The sketch below shows the FLS Longitudinal Bridge Reclaimer System.

Homogenization-FeatureArticle-Photo-1a

FL Smith longitudinal bridge scraper

In a longitudinal stockpile, one pile is formed (left part of the sketch) while the other is reclaimed (right part). The main principle is to form chevron layers in the stockpile from a pre-set mix of A, B and C. When the reclaimer slices the pile from the edge, the slice cuts through all the layers and ensures each layer has A., B and C in the right proportion according to the target chemistry. Subsequent material movement evens out the variation in each layer and brings about homogenization. Some strategy considerations are listed below:

  • Establish the target chemistry of the Pre- Blending Stockpile
  • Establish the regulated proportioning of the raw material components (A/B/C ratio) based on the target chemistry for the pile
  • Provide a metering arrangement for the materials A, B and C from hoppers or stockpiles
  • Ideally an on-line analyzer in the stacker belt establishes continuous analysis and cumulative composition of the pile
  • Continuous proportioning and proper stacking procedures should ensure that each material is spread throughout the length of the stockpile
  • Provide a sampling and analyzing system for the reclaimed material

As a result of the materials undergoing the “layering” and “slicing” process, the standard deviation of the chosen parameter (can be CaO) is reduced by a ratio of approximately 5 to 8.

Mill Feed Bins

The battery of feed bins for the raw mill consists of one large bin for the blended material from the preblending store, two or three smaller bins for materials that need to be added in small proportions, and one for the ‘sweetener’. The weigh feeder under each bin regulates the proportioning of each material necessary to reach the raw mix design. In this example, there are three bins, one for the blended material from the stockpile (A,B C mixed in the desired ratio), one bin for D, and one bin for E. The three weigh feeders meter the material in the desired ratio to the mill feed belt conveyor. Any section on the belt should theoretically contain the average kiln feed composition. Some strategic steps to be considered are listed below:

  • The single-most important consideration is to minimize the deviation in the composition. This is done by installing an on-line analyzer on the mill feed belt, which continuously monitors the composition and regulates the weigh feeders to adjust to the target kiln feed chemistry.
  • The milling process itself does not change the mean composition, but helps the homogenization

Homogenization-FeatureArticle-Photo-2

The product from the mill is aimed to have the mean chemistry according to the raw mix design. It will however still have some variation as it is filled into the next homogenizing section, the Homogenizing silo.

Homogenizing Silo

The Homogenizing Silo is the last zone where final homogenizing occurs. The Homogenizing Silo is expected to reduce the standard deviation of the Lime Saturation Factor (LSF) [assuming LSF is chosen as the control parameter] by a factor of 10, provided it is operated according to the prescribed strategy:

  • The silo should be at least 50-70% full of material at all times
  • The aeration at the silo bottom should occur adequately to fluidize the material
  • The extraction rate and sequence is regulated to bring about maximum mechanical movement of layers of material (see sketch below)

Homogenization-FeatureArticle-Photo-3

  • Automatic continuous samplers are installed at the silo feed point and silo extraction point
  • Samples are taken and analyzed regularly for monitoring the homogenizing efficiency of the silo and the final homogeneity of the kiln feed, which is the most important parameter to control

When the material is extracted from the silo, it will have all the desired materials A, B, C, D and E in the right proportion and homogenized. This material is fully prepared for feeding to the kiln.

Why Homogenization?

Inadequate kiln feed homogeneity causes unstable operation of the kiln resulting in the following potential problems:

  • Variation in clinker quality
  • Higher heat consumption
  • Variation in free lime in clinker
  • Unfavorable evaporation pattern of volatiles resulting in potential preheater blockages
  • Dusty kiln and kiln rushes

One of the primary requirements for consistent quality clinker is a well homogenized kiln feed.

Conclusions

The choice of suitable systems and the operating strategy must be developed around specific plant requirements depending on available raw materials, the logistics of transport of these materials into the plant, the proportion in which they are to be blended, and the inherent variation in the quality of these materials as they are received. A good system should deliver the kiln feed with a LSF standard deviation of less than 1%.


This article was contributed by Narayana (Jay) Jayaraman, Senior Consultant and Technical Services Director of PEC Consulting.. He has had in-depth exposure to the technical, economic and commercial aspects of large cement projects, and has extensive experience in the upgrade and optimization of cement plants. He has an M S in Mechanical Engineering from the Indian Institute of Technology (IIT), Kharagpur, India.

View additional feature articles under PublicationsContact Us


Geological Exploration of Industrial Minerals

While precious and base metals deposits are usually evaluated according to the weight of the minable elements to be recuperated per ton of ore, industrial mineral deposits are evaluated according to the end user’s product specifications. For example, the characteristics of a calcium carbonate deposit are evaluated according to the end-user’s application, including but not limited to CaO, MgO, heavy metal contents, whiteness, brightness and other physical and chemical properties. Some clays are evaluated according to particle size distribution, iron content and capacity to de-flocculate and susceptibility to forming a ceramic paste.

Industrial minerals play an important role in construction and infrastructure as a source of raw materials for manufacturing many construction materials. Applications may vary from cement, lime, glass and ceramics to paint fillers and plastics. Some industrial minerals are used for manufacturing cosmetics and pharmaceuticals.

There are certain factors that should be considered in the evaluation of an industrial minerals deposit. A very important one is the cost of logistics. Most precious metals deposits justify the construction of expensive access roads to haul the mineral out of remote areas. The transportation of industrial minerals from remote locations is unaffordable. Industrial minerals are usually conveyed for relatively short distances to be processed; however, once the end product is developed, it can be transported longer distances where there is demand for it and it can be delivered at a competitive price. Another factor to be considered in the evaluation of an industrial minerals deposit is the policies of the region and country where the deposit is located. Politics and social conditions also play an important role.

In the long term, markets evolve and change depending on the state of development of the area or country. A developing country or region might need considerable amounts of cement, lime and aggregates while more developed regions may have greater need for furniture, public transportation, cars, computers, pharmaceutical products, paints, cosmetics and other products. Therefore, an analysis of the market where a specific industrial mineral intends to be sold is an important priority.

Regardless the type of industrial mineral, the characterization of the deposit is essential. Giving consideration to the end user, it is paramount to understand the mineral distribution in the deposit. Even when characterization of a deposit seems to be a simple process, mistakes are made due to lack of understanding of the process. The following paragraphs provide guidelines necessary to evaluate an industrial minerals deposit.

Geological Exploration of Industrial Minerals fig-2

Figure 1 Core drilling in a remote area in Mexico. The equipment had to be kept as simple as possible due to the difficulties of moving it through the forest in an area without access roads. Construction of access roads was not justified at this evaluation stage. The deposit is a granitic rock being evaluated as a source of feldspar for the glass and ceramic industry.

Geological Mapping

Evaluation of mineral deposits should always start with a reliable geological map and a set of geological-structural sections. The set of geological-structural sections represents the first geological model, which can be created using any of the 3D modeling software available in the market. Geological models can be simple or sophisticated, depending on the structural setting and mineralization. The variables required by the end user will determine whether the model should integrate variations on the parameters of interest. The ideal industrial mineral deposit does not present many geological or structural changes; actually, the intent is to search for homogeneous materials which will produce an industrial mineral of high quality and consistency. Surface sampling should be conducted to identify the variation of different materialization parameters.

Characterization of the Mineral Deposit

The geological exploration should consider the variations associated to fractures, faults, bedding in the case of sedimentary deposits, and the variation of textures in the rock. Raw materials applicable for one industry may not necessarily comply with the requirements of other industries. For example, a white calcium carbonate may be used as filler for paints, but it will not necessarily comply with the specifications used in pharmaceuticals. The characterization of the deposit should be done according to the target industry. A deposit used for a specific application should be re-evaluated if the market specifications change or if the producer wishes to market to another end user with different requirements.

Eventually, the deposit will be drilled and the type of drilling required should be specified. There are two types of drilling: Core drilling and reverse circulation drilling. Core drilling provides more reliable information but it’s more expensive. Reverse Circulation (RC) is less expensive and faster, but some of the deposit characteristics may not be identifiable. For a true characterization of a deposit, a grid of boreholes using a core drilling rig may be necessary. RC drilling can be used later to obtain complementary information between core boreholes.

Data Organization and Data Management

There is a handful of software to organize borehole and complementary data. Borehole data may include borehole ID, XYZ location, total depth, orientation, inclination, lithologies, structural information, geochemical data, etc. Non-borehole data includes air photos, satellite images, contour lines, surface geochemistry, hydrology and geophysics.

The final objective of 3D modeling software is to visualize the deposit from any angle, which provides a better understanding of the deposit and facilitates the preparation of the mining plan. There are several ways to visualize the information. Geological cross-sections show the variations in the concentration of geochemical data in different directions. Horizontal sections at different elevations showing analytical results are commonly used for analysis. There is a wide range of visualization diagrams according to the type of data required to develop the mining plan.

Geological Exploration of Industrial Minerals fig-1

Figure 2 RC drilling in an area with good access roads in the Democratic Republic of Congo. Limestone deposit being evaluated for the production of lime and cement. Note the size of the equipment.

Mining Plan

Industrial minerals are usually inexpensive compared to base or precious metals, which may be mined underground and under the water table level. Industrial minerals usually cannot afford to be mined underground and are rarely mined under the water table. Some exceptions are when mining some clays or sands using dredges. Industrial minerals are usually mined in open pits and the presence or lack of overburden usually plays an important role in the cost of the end product.

Transportation between the mine and processing plant is also important. The lower the yield, the higher the cost impact of transportation. It is important to get rid of overburden and rejects as close to the quarry as possible to avoid the transportation cost of non-saleable materials.

The movement of material and use of equipment in the quarry will influence the final mining cost. The equipment used in the quarry should be highly efficient to keep mining costs at a minimum, but the skills of the heavy equipment operators are also important. The decision between front-end loaders or excavators (tires vs. tracks), type of hauling trucks, size of loading buckets are all as important factors as well as the efficiency of different brands of heavy equipment which might work better in the country or region where the project is located considering service and replacement parts.

Location of the Processing Plant

The best location for the processing plant is adjacent the quarry, but this is not always possible. There are many parameters that have to be taken into consideration, for example availability of land, water, power source, labor, access, environmental issues, etc.

CONCLUSIONS

The exploration of industrial minerals should be based on the demand of the end product. Industrial minerals cannot afford to be hauled long distances. They are dependent on the specifications of the end user, so the location of industrial minerals deposits is tied to developed areas with appropriate infrastructure and access roads. Every deposit is different and therefore all factors should be considered. Cultural factors, construction methods, and the economy of the region are important considerations.


This article was contributed by Mario Mansilla, Senior Consultant/Geology at PEC Consulting Group. He has 30 years experience in the mining industry, mostly in industrial minerals. He has done evaluation of mineral deposits, and technical and geological studies for projects around the globe. He has a BS in Geology from the Universidad Autónoma de San Luis Potosi, México; an MS degree in Geology from Westfälishe-Wilhelms Universität Münster, Germany, and Postgraduate degree in Environmental Analysis, Instituto Tecnológico de Estudios Superiores de Monterrey.

View additional feature articles under PublicationsContact Us


Reclaiming from Mineral Stockpiles

A very common feature in minerals plants is the materials handling tunnel. Most tunnels are rectangular because the cement finisher has forms for this type of structure. However, from the point of view of a structural engineer (see figure 1), this is a very inefficient type of load carrying system. The top and bottom (foundation) of the tunnel is quite thick because they must span across the tunnel width as a simple beam This beam action means the designer keeps these members thick, using more rebar and concrete than the alternative, the arched tunnel.

Reclaiming-from-Mineral-Stockpiles-Fig1-Rectangular Tunnel

Figure 1: A simple rectangular tunnel with a 36″ standard troughed conveyor with access on both sides requires an 11 ft tunnel width

The thickness of the shell wall is to allow some anchorage for the moment transfer of the roof around to the side of the box culvert (rectangular section) This is generally a lightly reinforced section. By this we mean that the amount of steel per cubic yard of concrete is closer 200 lbs than 400 lbs per cubic yard.

The alternative section is the arched section shown in Figure 2. The inside dimensions are the same (11’ wide by 9 feet high) in both figures. The thickness of the shell walls however are considerably thinner in the arched tunnel. You will recognize the shape of this tunnel if you are a student of older masonry arch structures. Many of these tunnels were built with no mortar, and just a keystone at the center top to provide stability in all directions. This arched tunnel uses about 1/3 of the concrete that the rectangular tunnel needs, and is a lightly reinforced section (about 175 lbs per cubic yard of concrete).

Reclaiming-from-Mineral-Stockpiles-Fig2-arched tunnel section

Figure 2: An arched tunnel with the same interior dimensions as the rectangular tunnel in Figure 1

Figure 3 shows a view of an arched tunnel from the inside of the tunnel. Using a Kynar type of urethane high gloss paint will provide a very bright surface to the inside of the tunnel, as well as a place to screw the electrical conduit and junction boxes to, prior to the shotcrete process on the outside of the arch.

These tunnels are easy to slope, providing a good drainage method for any stray water that gets into the structural system.

Reclaiming-from-Mineral-Stockpiles-Fig3

Figure 3: This arched tunnel is formed by using gage metal, formed in and seamed together to provide structure support for the concrete (shotcrete) roof

Figure 4 is a photo from the exterior of the tunnel. A curb will be used at the feeder openings to form up the rough openings for the feeders. Shotcrete is a very dense form of concrete; however, some customers also coat the exterior surface with a waterproofing mastic for additional protection against moisture.

Reclaiming-from-Mineral-Stockpiles-Fig4-2007IntrepidTunnel top-hoppers 043

Figure 4: Shotcrete top surface of the tunnel, with the rough openings showing where the feeder points will be located

The typical cost of an arched tunnel is about half the cost of a rectangular tunnel. Many contractors use the seamless roofing shown here. Others will inflate a reusable membrane. The larger (longer) the project, the less the unit cost will tend to be. Typical uses for these tunnels are all types of bulk materials reclaim including:

  • Coal
  • Coke
  • Cement Clinker
  • Limestone
  • Pebble Lime
  • Wooden Pellets
  • Ores
  • Frac (Proppant) Sand

Basically, if the material will flow through a feeder, this type of tunnel is appropriate.


This article was contributed by T.W.Hedrick, PE Senior Consultant for PEC Consulting, he has been in manufacturing and engineering for 40 years, holds seven U.S. patents and has written several dozen technical papers for various magazines and conferences around the world.

View additional feature articles under PublicationsContact Us


Best Practices in Frac Sand Plant Design

The sample project is a frac sand plant located in the beautiful hill country of Texas, U.S.A. It has been designed in two phases: the first one taking place now and the second phase to take place in the future. The latter will double the size of the plant to over 4 million tons per year, with logistics running 24 hours per day, 7 days per week.

An important starting point of all projects is permitting. Construction cannot start until permits are issued. A 3-D modeling presentation that demonstrates an environmentally friendly plant makes a better presentation for permitting meetings. Figure 1 is such a model. The border has earthen berms to hide the view from the passing public. The berms will be planted with native wild flowers and trees. Modeling will be used to prevent plant lights from distracting the passing public both in directionality and lamp shading.

best-practices-frac-sand-plant-design figure-1

Figure 1: Site plan viewed from entry road

There are two interconnected water collection ponds along the left diagonal of the site. The centermost pond has a pumping station to recycle water back into the process. All aspects of the site are designed for maximum water conservation. Processing efficiency was benchmarked at about 50% of water used in other similar operations in the area.

In Figure 1, on the right side of the property, a deceleration lane was designed for queuing the trucks off of the public highway. The maximum utilization of existing trees helps blending the site into the natural topography of the area. The access road around the perimeter of the plant weaves in and out of these trees.

By rotating the model to a view from a passing car’s perspective, the site looks like Figure 2. The berm height is 15’; it is shown here without vegetation. The load-out silos are the tallest point on the property and the dry screening plant is to the right of the silos. Using the model in this fashion, each neighbor will be able to see a rendering of the facility from their vantage point.

best-practices-frac-sand-plant-design figure-2

Figure 2: Motorist view from the highway

best-practices-frac-sand-plant-design figure-3

Figure 3: View from the back of the property. The primary crusher is on the right

Three quarters of a million dollars was saved by placing the Primary Crusher in the pit rather than building retaining walls around the primary crusher pit. This area is on the right side of the rendering (Figure 3). The trucks dump directly into the feed hopper. There is plenty of room for maintenance access around the equipment. Just to the left of the crusher is a creek bed. No traffic is allowed across the creek, so crusher access will be from the right. The secondary screening plant is on the left side of the page, with minus ¾” feed to the extreme left.

The primary crusher circuit includes a vibrating grizzly to remove the fines and a Jaw Crusher set at 2”. This closed side setting mates well with a vertical shaft impactor used as a secondary crusher.

The secondary screens are rated at 1,400 tph including the recirculation load. The traditional solution would be two 8’ x 24’ double deck vibrating screens. The screen shown in figure 4, a single 12’ x 24’ high horizontal impact screen for the same task was evaluated. This eliminated a complicated feed section (for two screens, three conveyor belts and a much larger building). Not counting electrical savings, the project saved over one million dollars and ended up with a highly reliable screen solution.

best-practices-frac-sand-plant-design figure-4

Figure 4: Ludowici double deck Banana screen

A common method to stockpile sand is by utilizing a radial stacking conveyor. One very easy way to increase the volume of stored material at little additional cost is by using a telescoping radial stacker. Figure 5 shows the original stacked volume (shown in lighter buff), which can be more than doubled by extending the stacker (shown in darker buff). A number of manufacturers offer telescoping radial stackers, which claim additional benefits of wind-rowing the storage to minimize segregation. Both stacking storage yards in this project utilize this technique.

best-practices-frac-sand-plant-design figure-5

Figure 5: Telescoping radial stacker can double the product storage volume for a modest cost increase.

Attrition scrubbers are used to break up the sandstone into individual particles. Hydraulic cyclone separators are used along with a hydrosizer to capture the particle size desired (ASTM 16 mesh to ASTM 70 mesh); the rest is sent to spoils. A second scrubber circuit is used to liberate any final sticky sand. This plant uses a bucket wheel to dewater the product. Spoils are pumped back to a vacant quarry rather than returned with an overland conveyor. This plant operates with about 25% product reclaim. With both phases in operation, 16 million tons will be mined annually and reclaim 4 million tons of products.

best-practices-frac-sand-plant-design figure-6

Figure 6: Wet plant tunnel section

The wet storage pile contains the product sizes desired. Figure 7 shows an important step in the preparation for the reclaim tunnel. A percolation field draws down the moisture content. Typically without the field, the 13% moisture in the wet plant discharge will reach about 6% moisture by utilizing inventory management (using the drained or older sand before the newly processed sand). By utilizing the percolation field, the 6% moisture can be reduced to 4% moisture.

Another feature of the design is to use an arched tunnel (see Figure 6) rather than a rectangular tunnel section. The obvious advantage is that the water from the storage migrates around the tunnel rather than lies on the flat roof and ultimately collects inside the collection system. Dewatering feeders collect water from the tunnel and pipe it to the outside. The grade of the tunnel is 1% for positive drainage. Hanging the conveyors from the concrete tunnel makes cleanup much easier.

One last feature of the tunnel system is that the pile orientation is such that the wind blows along the pile 95% of the time, rather than across the pile. The product sand is very susceptible to wind dune action. Pile orientation is a very important feature.

The wet pile area is under laid with an impervious membrane, which includes the low point of the pile to the collection pond (to the right in Figure 7). As much as possible, all process water is recycled.

best-practices-frac-sand-plant-design figure-7

Figure 7: Percolation field under wet storage

With today’s long range, low price outlook a natural gas generator may be used to generate both plant power and provide the energy from the turbine exhaust to dry sand in a rotary or fluid bed dryer. Payback depends on an agreement with the utility company and on the price of electricity. An analysis on this plant with moderate electrical costs the simple payback appears attractive (see Figure 8). Various models of Caterpillar generator sets were investigated (along the x-axis), since they are easily maintained by agreement with the local dealer, keeping ownership simple.

The graph includes various costs for natural gas ($3.00 to $5.00), and the resulting payback for the generator sets. The payback zone is a colored band over the several generator sets and given their costs (and switchgear plus installation) with the variation in gas costs.

best-practices-frac-sand-plant-design figure-8

Figure 8: Payback analysis based on cost of gas and moisture content of sand

To properly evaluate the gyratory screening equipment, the cost of the building must be included. Issues of changes in structural support between various OEM schemes including the finished product screen tower were evaluated.

Four products are distributed by the red colored bucket elevators on the left to 6 silos of the dispatch storage. The flat floor of the concrete allows the use of one discharge equipment set on rollers such that it may be placed in multiple locations. The flat slab keeps costs lower. The typical steel bins on structural legs were engineered earlier in the project. As the client’s loading capacity increased, this became less of an option. One problem with multiple steel bins is that with complex conveyor systems distributing product at the roof level, structural supports become very complex. With concrete silos, the flat roof provides needed support wherever it may occur.

The silo set has two analyzer rooms at the upper loading floor for quick quality control analysis of each truck as it is loaded. An average of 240 trucks is loaded each day, 7 days per week. For peak loading, 6 lanes were chosen with 140’ long scales so that easy access is provided under all loading positions.

Provisions were made for flushing silos should QC reject product. This structure is the tallest of all the buildings and, as noted in Figure 2, is the main focal point a passer-by will see of the facility.

best-practices-frac-sand-plant-design figure-9

Figure 9: Silo plan and elevation views

Prefabricated electrical rooms are very easy to fit into a project. As shown in Figure 10 the room is elevated to allow room for easy access with larger cables. The transformers can be easily located nearby and the rooms are provided with both cooling and pressurization to keep out the dust and sand. In this project, electrical rooms are divided and one part serves as the local control room for the operation of certain areas of the plant. For larger needs, multiple rooms can be joined. For other projects, electrical rooms have been elevated like the one pictured to the top of silos for easy modular controls.

best-practices-frac-sand-plant-design figure-10

Figure 10: Prefabricated electrical room

One feature of all projects that should be considered is the next phase. There is always a need to expand. Thinking about where the expansion goes, the access to the new phase should be considered right away. Electrical rooms need extra capacity and a location that is convenient to both phases. In this case, the permit application included the second phase emissions.

Another important feature of good design is to consider maintenance and access. For example, conveyors were hung from the tunnels for cleanup access. The transfer towers were constructed as slab-on grade with elevated slabs (because plants seem to buildup elevation over time) and k-bracing allowing bob-cat access for cleanup. Castigated s-section trolley beams (beams with punched holes in them for come-along anchoring) were specified. Each piece of equipment was checked for proper maintenance access. The use of roll-away chutes in front of multi-deck screens is recommended so that the crew that needs access for screen changes can roll away the chute work.


This article was contributed by T.W.Hedrick, PE Senior Consultant for PEC Consulting, he has been in manufacturing and engineering for 40 years, holds seven U.S. patents and has written several dozen technical papers for various magazines and conferences around the world.

View additional feature articles under PublicationsContact Us


Discrete Event Simulation of In-Mine Logistics

Debottlenecking loader/truck/crushing operations is a concern in most mineral ore processing facilities.

Utilizing computer simulation using mathematical and logical relationships to replicate a real system is the best way to design or optimize an operation, prepare facility layouts and select mobile equipment. Discrete event simulation (DES) involves events (arrival, departure, etc.) that occur at discrete points in time. DES involves random processes -typically, some theoretical statistical distribution- which is handled using Monte Carlo simulation. There are various special purpose simulation languages, like GPSS, Simscript, SLAM and SIMAN for modeling discrete and mixed continuous-discrete event systems. At PEC Consulting we use Arena®, which is based on the SIMAN simulation language.

july-article-2013-discrete-event-simulation-photo-1

DES applications are ideal for mining activities, material handling systems, and transportation systems. We use DES to study truck-shovel systems, underground haulage systems, mine-to-mill systems, and more. The models provide value to the engineering and management teams who commission the studies.

The main purpose of simulation and DES is to examine alternate scenarios (what-if analysis) on the computer, which is exponentially less expensive than the real system trial-and-error or experience. For example, the cost of using computer simulation to examine the effect of adding a dump truck to a mine’s haulage system is minimal compared to the real cost of adding a truck, even when the truck is leased. The choice is between analyzing the system with simple spreadsheets, other operations research techniques (e.g. queuing theory), or heuristics (experience based set of rules).

july-article-2013-discrete-event-simulation-photo-2

Photo courtesy of Catepillar.

The main advantages of DES are:

  • Flexibility to model various levels of detail and complexity
  • Allows modeling of uncertainty
  • Allows modeling of dynamic (time changing) systems, and
  • Advances and variety in DES software (such as those mentioned above)

The main disadvantages are:

  • DES provides only approximations/estimates of your model outputs, which is nonetheless all that is possible in most complex systems, and
  • DES is heavily reliant on statistics, with which most engineers are not comfortable

There are three main motivations for using DES:

  • The system under study has significant variability in input variables
  • Enough data is available or can be collected to fully characterize the variability in key input variables, and
  • The risk of making the wrong decision outweighs the costs of the simulation study

july-article-2013-discrete-event-simulation-photo-3

In most mining operations, there are several causes of variability in input variables. For instance, cycle times, equipment reliability, and payloads are all variable in material handling systems. It is easy to assume that using the mean values of these varying inputs can provide a good estimate of system performance. While that estimate is good, such an analysis (which is what you get for spreadsheet-type analysis) does not account for the effects of the variability. If you are evaluating the effect of adding one more hauler to your system, for example, using the mean cycle times will provide an estimate of the expected increase in production. It does not answer questions like, how often (probability) will I achieve that increase due to the variability in the system? What will be the worst queue of haulers I will have at the shipping yard or loading point?

An important aspect of any simulation study is the input data. Enough data must be available to allow statistical goodness-of-fit tests, which will determine what distributions to use for various inputs. These days though with the advent of dispatching systems and various automation systems, data collection is much easier.

july-article-2013-discrete-event-simulation-photo-4

Simulation is not inexpensive. It requires time and resources to do a good job. A good team needs to be put together with various stakeholders, not just the analyst and engineers, to describe the system and help determine alternatives to be studied. Most often, the skills required to build a good simulation model are not found in-house and require hiring a consultant.

Bunching project animation from Kwame Awuah-Offei on Vimeo.

PEC Consulting Group has provided modeling services to cement, lime, and aggregates operations. In doing so, we have helped in providing a tool to analyze the ‘what if’ scenarios for our clients’ quarry operations.

Article contributed by: Kwame Awuah-Offei, PhD

Dr. Kwame Awuah-Offei collaborates as a Senior Consultant in Mining. He has extensive experience in modeling, simulation, and optimization of mining systems. He has worked in surface gold mining and aggregates operations, mine engineering, and in the development of mine plans. Dr. Awuah-Offei holds a PhD from Missouri University of Science and Technology, and a BS from the Kwame Nkrumah University of Science and Technology in Ghana.

View additional feature articles under PublicationsContact Us


Quicklime and By-Products

Metallurgical

The largest use of lime is in steel manufacturing, where it serves as a flux to remove impurities (silica, phosphorus, and sulfur). Lime is used in basic oxygen furnaces and electric arc furnaces, as well as in secondary refining.

Iron & Steel

High calcium and dolomitic limes are used extensively as a flux in purifying steel in the traditional basic oxygen furnace (BOF) and the newer electric arc furnace (EAF). In the BOF, the lime factor per ton of steel averages 150lb/ton, while in the EAF the factor is 85lb/ton. Lime is very effective in removing phosphorus, sulfur, and silica and, to a lesser extent, manganese. The higher the silica and phosphorus content in the iron ore, the higher the quicklime consumption.

Nonferrous Metallurgy

Lime is also essential in the production of non-ferrous metals. For example, quicklime is used to remove silica from bauxite ore and for causticization in the manufacturing of alumina. Dolomitic quicklime is used to produce metallic magnesium by thermal reduction which reduces magnesium oxide. Lime is also used in the processing of ores and the subsequent smelting and refining of copper, zinc, lead, and other non-ferrous ores.

Environmental

The use of lime to address environmental problems is one of the fastest growing markets for lime products. Lime is used in almost every area of pollution prevention, including treatment of air emissions, treatment of drinking water and waste waters, and remediation of hazardous wastes.

Flue Gas Desulfurization

Flue Gas Treatment – Lime is used to remove sulfur dioxide (SO2) and hydrogen chloride (HCL) from flue gases. SO2 removal efficiencies using lime scrubbers range from 80 to 99% at electric generation plants. HCL removal efficiencies using lime range from 30 to 50% at municipal waste to energy plants1.

Mercury Removal – There are many methods for controlling mercury emissions. One control technology currently being evaluated is using hydrated lime together with activated carbon to capture mercury in the off-gases from power plant and pyro-processing industries.

Water Treatment

Drinking water treatment – Lime is the main chemical used in the treatment of potable and industrial water.

– Water Softening – Hardness caused by bicarbonate and carbonate of calcium and magnesium is removed by using hydrated lime. Hardness caused by other calcium and magnesium salts is removed by using soda ash.

– PH Adjustment – Hydrated lime is used to adjust the pH of water to prepare it for further treatment. Lime is also used to fight “red water” by neutralizing acid water, therefore reducing corrosion in pipes.- Pathogen Growth

– Lime prevents the growth of bacteria and some viruses by controlling the water pH between 10.5 — 11.- Removal of Impurities – dolomitic lime is used to remove silica. Lime is also used to remove manganese, fluoride, and iron.

Wastewater Treatment – Lime is extensively used in industrial and municipal water treatment.

– Municipal Water Treatment – Lime precipitation is used in preventing eutrophication (algae build up) on water surface by precipitating phosphorous and other suspended and dissolved solids. In the process of coagulation, alum and ferric chloride are used to lower the pH. Lime is used to counteract the pH level and allow efficient nitrogen removal.

– Industrial Wastewater – Lime is used by neutralizing sulfuric acid in steel plants where the iron salts are precipitated. Lime also neutralizes and precipitates chrome, copper, and heavy metals in the treatment of water discharged from plating plants.

Sludge Treatment

Quicklime and calcium hydroxide is widely used and is a cost-effective option to treat biological wastes. Lime injection helps control the environment to prevent the growth of pathogens in waste water sludge like biosolids and convert sludge into a usable product.

– Calcium hydroxide creates a high alkaline compound with pH, as high as 12.4. At pH level above 12 the cell membranes of harmful pathogens are destroyed. The high pH also provides a barrier for flies and other insects to infect treated biological wastes.

– Quicklime injection creates an exothermic reaction increasing the temperature to 70°C which provides pasteurization that meets EPA’s Class A requirements.

– The high pH will precipitate most metals present in the waste and reduce the solubility. It also provides free calcium ions that react with odorous sulfur destroying the waste odor.- Adding lime also increases the solid content of the waste making it easier to handle.

Lime-treated biosolids are safe and promote recycling. As EPA notes “properly prepared biosolids provide a rich source of essential fertilizer elements needed by plants to produce food.”

Animal Wastes- Excessive buildup of animal waste creates an excess of phosphorus and nitrogen which cannot be absorbed by the soil. The addition of hydrated lime to animal manure converts manure to a usable form of fertilizer that contains the correct amount of nutrients which can be absorbed into the soil and used by plants.

Hydrated lime also aids in destroying odors, especially hydrogen sulfide odors, which result from the accumulation of large quantities of manure.

Currently, lime is not widely used to treat animal sludge, but it can offer a practical and economical option.

Acid Mine Drainage – Lime is used to neutralize highly acidic drainage from mines. Lime is also used in coal washing plants to reduce equipment corrosion.

Chemical and Industrial Uses

Agricultural Lime (Aglime) and fertilizer – Hydrated lime balances soil pH for proper plant growth and nutrient intake by neutralizing garden soils. Many plants cannot tolerate acidic soils and prefer soil conditions that are neutral to slightly alkaline, pH between 6 and 7.

Lime in the US has been substituted by ground calcium carbonate; however, in Europe hydrated lime is used in conjunction with nitrogen fertilizers reduces the use of fertilizer.

Glass – A glass batch is composed of approximately 70% sand, 18% soda ash, and 12% lime, usually in the form of dolomitic lime.

Paper and Pulp – Lime is an important additive in the papermaking industry; however, a shift from acidic to an alkaline process has changed levels of consumption as noted below:

Sulfate Process – The largest application of lime in pulp manufacturing is as a causticizing agent in sulfate (Kraft) plants. Wasted sodium carbonate is then reacted with high calcium lime to generate caustic soda for reuse in the process. Plants are able to recover about 90-98%2 of the lime by dewatering the waste calcium carbonate mud, then re-calcining it in rotary kilns.

Sulfite Process – Plants using the sulfite process consumed large quantities of quicklime for the preparation of the calcium bisulfite liquor capable of dissolving the noncellulosic wood elements. This process is disappearing due to waste disposal problems.

Bleaching – lime is used as a bleaching agent for pulp.

Precipitated Calcium Carbonate (PCC) – PCC is use as a filler and coating pigment for premium quality paper enhancing the brightness, color, smoothness, and bulk of the paper, replacing more expensive paper pulp. Approximately 75%3 of worldwide PCC production is used in the paper industry.

PCC is also used as a plastic additive, white paint pigment, putty, sealer and adhesives ingredient. It is also an important ingredient in toothpaste.

Sugar Refining

Hydrated Lime is used in the production of sugar from both sugar cane and sugar beet. Approximately 200 kg of lime are required to produce one ton of beet sugar, and about 10 kg are required for one ton of cane sugar.

Crude sugar juice (sucrose) is treated with lime to raise the pH and to precipitate calcium salts of organic and inorganic acids. These insoluble compounds are filtered. Carbon dioxide is then passed through the suspension to precipitate excess lime as calcium carbonate. Precipitated carbonate sludge is filtered out. This process can be repeated several times in order to achieve greater purity of the sugar solution.

Construction

Asphalt – Hydrated lime acts as a mineral filler by stiffening the asphalt binder in hot mix asphalt (HMA), improving resistance to fracture, altering oxidation kinetics and interacting with products of oxidation to reduce their effects.

Building Uses – Hydrated Lime is added to cement and sand to create mortar with superior strength and low water permeability. Hydrated Lime is also used as an ingredient in stuccos and plasters, enhancing strength, durability and workability of these materials.

Soils Stabilization – Quicklime and hydrated lime can significantly improve subgrade engineering properties by increasing the stability, impermeability, and load bearing capacity of the subgrade. It is extensively used in soil stabilization beneath roads and similar construction projects. Quicklime is also used to dry wet soils at construction sites.

Other Construction – Lime is used with pozzolans and Portland cement in the manufacturing of lightweight cellular concrete products.

Refractories

Refractory dolomite is manufactured with dolomitic lime. Iron oxides are added to stabilize the resulting hard-burned quicklime against decomposition from moisture. This material is used to make refractory bricks

Silica Bricks, used for lining furnaces, are made by mixing ground silica with 1 to 3% milk of lime.

The U.S. Market

In 2012, an estimated 19.54 million metric tons of quicklime and hydrated lime were produced in the U.S. The approximate breakdown of lime consumption by general end-use sectors was as follows: 38% for metallurgical uses, 31% for environmental uses, 22% for chemical and industrial uses, 8% for construction uses, and 1% for refractory dolomite (Table 1).

Commercial sales accounted for 91% of total lime consumption and 92% of domestic production. Captive lime accounted for the remainder of consumption and was used in the production of steel in basic oxygen furnaces (BOF), magnesia production, precipitated calcium carbonate production, sugar refining, and refractories (dead-burned dolomite). The data on captive lime consumption are withheld to avoid disclosing company proprietary information; so Table 1 only shows the application of lime for commercial uses.

quick-lime-and-by-products-Table-Lime-Use-by-Producer


1National Lime Association – Environmental Uses, Flue Gas Treatment

2Lime Fact bulletin, National Lime Association, Pulp and Paper

3Lime Fact bulletin, National Lime Association, Precipitated Calcium Carbonate

4USGS Mineral Commodity Summaries, January 2013

Pompeyo D. Rios is a Consultant with PEC Consulting Group. He has been with PENTA Engineering for over thirteen years. Mr. Rios has a BS in Mechanical Engineering from the Universidad Metropolitana, Caracas, Venezuela, and a Masters in Business Administration from Regis University, Denver, CO. He has extensive knowledge of the cement and lime industries and is constantly keeping abreast of the latest technologies applicable to both these industries.

View additional feature articles under PublicationsContact Us


Bulk Storage Choices

Bulk storage requirements in processing and distribution facilities can range in capacity from a few thousand tons to several hundred thousand tons. Years ago, materials were piled outside and automation was accomplished by adding a reclaim tunnel with mechanical feeders. Compliance with today’s environmental regulations, energy use concerns, and quality control issues require that storages be properly covered.

PEC Consulting Group assists its customers in finding practical and economic choices for their bulk storage needs.

First to be determined is the degree of automation of the loading and reclaim systems and other special materials handling process requirements.

bulk-storage-choices-feature-article-figure 1 -two tunnels gravity feedIn the case of non-sticky materials, simple gravity flow allows the use of tunnel systems with bulk feeder points similar to Figure 1. Gravity flow also works well when considerations for storage do not involve combustible materials (for example coal, coke or wood pellets). Tunnel withdrawal is an economical form of reclaiming from a storage facility.

Figure 1 – Two Tunnels, Gravity Feed

bulk-storage-choices-feature-article-figure 2 -drawdown hopper with mechancial aggitationSticky solids, and those that suffer size degradation like pebble lime and salt, require special extraction methods. Figure 2 shows one way to extract materials by activating the flow with a specialized feeder.

Figure 2- Drawdown Hopper with Mechanical Agitation

Fluidizable powders such as Portland cement, fly ash, powder alumina and pulverized stone require different approaches. Figure 3 illustrates a storage silo where the center of the storage has an inverted cone. Depending on the size of storage capacity, a fully fluidized floor such as the one shown in Figure 4 may be more economical.

bulk-storage-choices-feature-article-figure 3 -ibau style inverted cone for fluidizable powdersbulk-storage-choices-feature-article-figure 4 - 30k live cuM FA Storage Dome
Figure 3 – Ibau Style Inverted Cone for Fluidizable Powders
Figure 4 – 30k (live) cuM FA Storage Dome

bulk-storage-choices-feature-article-figure 5 - wooden pellet storage
Alternatively, a sweep screw system (Figure 5) may be used to reclaim some types of material. Sweep screws have limitations on how much material can be stored above the screw and how large a diameter the storage structure can be.

Figure 5 -Wooden Pellet Storage


bulk-storage-choices-feature-article-figure 6 - cement silos buffalo island houston txSilo packs (Figure 6) have a high center of mass and loads concentrated over a relatively small footprint. Typical silos demand structural engineers to design expensive deep foundations (piling).

Figure 6 – Cement Silos, Buffalo Island, Housten, TX


bulk-storage-choices-feature-article-figure 7 - dome in port of tampa cement not on direct soil bearingAn alternative is a concrete dome structure such as Figure 7, where the center of mass is low and typically the structure and mechanical withdrawal systems are purposely designed to allow differential settlement (eliminating deep foundation costs in unstable soils).

Figure 7 – Dome in Port of Tampa (Cement)

Most of the above mentioned storage systems require mechanical systems for withdrawal. Optimizing the storage footprint (for example a silo or dome diameter) require value-engineering by an experienced engineer in the design of these structures. The cost of tall silos with gravity discharge vs. short and wide ones with more mechanical systems and with withdrawal tunnels must be part of a study to evaluate both the technical and economical factors which will lead to a sound decision in selecting the type of storage facility.

bulk-storage-choices-feature-article-figure 8 - bulk storage facility at dock faceThe diameter consideration must take into account the site conditions where the storage is to be placed. For example, Figure 8 shows a bulk storage facility at a dock-face. The deep water ship-mooring next to the dock-face will require substantial deep foundations to carry the weight of the storage structure. Would it be a better choice to evaluate a longer conveying system so that the piling requirements were lower or eliminated?

Figure 8 – Bulk Storage Facility at Dock Face

Bulk materials storage is a highly specialized field and in this article we have only touched on a few issues. Proven technologies are available for your specific needs. The cost to meet your storage requirements is paramount to the economic feasibility of your project. Call on PEC Consulting to assist you (fbenavides@peccg.com).

Article contributed by T.W. Hedrick, PE

View additional feature articles under PublicationsContact Us


Constructability – Heart of the Project Costs

Constructability review starts with the Original Equipment Manufacturer (OEM) contracts for equipment. Specifically, how many parts did the equipment price include? Where are these manufactured? What amount of site fabrication is required to assemble each machine? How complete was the equipment scope? This is the heart of the project cost, the sum of costs from the OEM, freight, site fabrication and scheduled time to completion.

For the constructability topic, two actual projects, Project 1 and Project 2, are used as examples in this article. Both projects start with the purchase of equipment (OEM contracts) and end with a working Brownfield cement production facility constructed next to a working cement plant. The sites have reserves of good quality raw materials and there is an increased market demand for production. Often, the Consultant is asked by the Client what will be the Capital Cost (CapEx) and Schedule for the Project. The Client also needs a cash flow analysis of capital expenditures and needs to know when he can expect the new facility to start producing a saleable product to obtain a payback.

constructability-feature-article-figure-1-project-cash-flow-graph

Figure 1: Example of Project Cash Flow, by Quarter

Typically, some engineering costs take place in the early part of the project development before the OEM vendors are contracted to supply the equipment. Elements that bear on the constructability for the OEM contract include:

    1. The number of pieces included in the project
        a. For example: is the Kiln shell in 4 sections, or 40
    2. The amount of field welding expected by the contractor
        a. What length of welding is required, and what types and sizes
        b. Are the anchor bolts by the OEM or contractor
        c. Are the assembly bolts by the OEM or contractor
    3. The weight of the various sub-assemblies
        a. Necessary in comparing various OEM suppliers
        b. For logistics we need to know the shipping weight
        c. Contractor needs assembly lifting weights
    4. The Country of origin of the fabrication
        a. Important for logistics
        b. Important for taxes

Note that the two projects in this article are real.
constructability-feature-article-figure-2-contrast-projects

Figure 2: Differences in Projects

constructability-feature-article-figure-3

Figure 3 illustrates Project 1 preheater cyclones being transported from barge to a staging area.

On both projects, the structural design was started simultaneously with the OEM contract award. For Project 1, one of the first fabrication contracts was the pre-heater tower steel fabrication. For Project 2, the first contract was the pre-heater slip formed concrete design. The duration of engineering was approximately the same for both projects.

Figure 3, Project 1 – Site Transport from Water transportation to site staging area

constructability-feature-article-figure-4

Figure 4 is of Project 2 during the slip-forming process. Both projects had slip-formed silos.

After the structural completion of the pre-heater, major vessels in Project 2 had to be elevated over the precast pre-heater and then erected into place. Figure 5 is of Project 1 during construction of the pre-heater. One advantage of a structural steel pre-heater tower is that the pyro-process vessels can be erected simultaneously with the structural steel. The same figure illustrates that the contractor had the kiln placed on the kiln piers and the bag-house at the time the pre-heater tower was finishing off.


Figure 4, Project 2 – Slip forming the homo silo and pre-heater structure

constructability-feature-article-figure-5

Site safety is affected by clutter and lack of proper sequencing of activities. Figure 6 is a photograph taken during the erection of the tertiary air duct on Project 1.


Figure 5, Project 1 – during the pre-heater construction

constructability-feature-article-figure-6

Figure 6, Project 1 – Construction of the tertiary air duct

Figure 7 was taken during the alignment over the first kiln pier looking toward the preheater tower on Project 2.

constructability-feature-article-figure-7

Figure 7, Project 2 – looking over kiln pier towards preheater tower

MSHA or OSHA safety officials would not allow the site clutter and violations as shown in Figure 8 of Project 2. Does safety pay? It certainly was evident with Project 1, which maintained the predicted schedule throughout its duration without time loss due to accidents.

constructability-feature-article-figure-8

Figure 8, Project 2 – Pre-heater foundation formwork

Throughout Project 2, there is heavy presence of fixed scaffolds. As noted in figure 9, the utilization of many man-lifts is customary in the U.S.

constructability-feature-article-figure-9

Figure 9, Project 1 – A very minimal amount of scaffold was used. Man lifts are very prevalent.

Figure 10 is uncluttered because the mason used an elevated scaffold. Primarily, this keeps the work height relative to each mason ideal for productivity.

constructability-feature-article-figure-10

Figure 10: Elevating Scaffold keep the Masons at ideal working elevation

Fixed scaffolding cannot keep masons at the ideal height but, as Figure 11 from Project 2 illustrates, ramps for the hod carriers do make for efficient delivery when a high-lift fork lift is not in use.

constructability-feature-article-figure-11

Figure 11, Project 2 – Masonry Scaffold with Ramps for efficient work height

We have looked briefly at two projects. Does scaffolding, project safety, or type of forming define a short or long schedule? Is there magic in a steel vs. a concrete pre-heater structure? Only to an incremental degree. When performing a constructability review, we consider how well the integration of OEM supply is to the engineering; the structural plans are thus available for bidding on time and the logistics, both to and through the site, are taken into consideration. Are the lay-down areas really just that, or are they pre-assembly areas that would have been better served at the OEM’s location than at the construction site?

We look for innovationlike in Figure 12, where the existing primary crusher operates throughout a retaining wall construction using gabions to maintain a wide and safe ramp for quarry feed stone. We look for realistic delivery schedules and integrated structures with the mechanical OEM equipment. We look for electric power to be installed and ready for use prior to commissioning.

constructability-feature-article-figure-12

Figure 12, Project 1 – Contractor used rock gabions for retaining walls

Experienced planning and a team that starts with the equipment purchase contract will result in a realistic and short construction schedule. Remember that the owner will not see a return on investment (ROI) until the plant is operating efficiently. The Constructability Review will definitely increase the ROI.

Which Owner will you be? As in Project 1, with a schedule completed in 19 months, or will you still be looking at construction costs 60 months later and wondering if you will ever produce? PEC Consulting’s staff has extensive experience on Constructability Reviews and stands by to assist you.

Thomas W. Hedrick, P.E. is a structural engineer with a specialty in materials handling. He has over 35 years’ experience in industrial projects and holds several US patents. Mr. Hedrick writes for many magazines, and maintains a passion for excellence in client relations and project execution. Please give us the opportunity to review your project for constructability.

View additional feature articles under PublicationsContact Us


Frac Sand Dryer to Power Generator

Would you like to have free heat for your Proppant sand dryer; or free electric power? Actually, these are related and you may be a candidate for substituting the hot gas generator for your sand dryer with a gas turbine generator.

A good candidate for this application is a sand plant that operates around the clock, year round. The closer your manufacturing process is to full utilization, the more likely you are to economically generate your own electric power and to routing and conditioning the exhaust gas from the generator to your sand drying process for an overall savings in plant energy costs.

frac-sand-dryer-to-power-generator-figure-1

Figure 1: Mars 100, Gas Turbine Generator Set, by Caterpillar

CASE STUDY

  • Cost of power from the grid: $0.07 KW/hr.
  • For off- hours, in a permitted co-generator situation, the State mandates a $0.04 KW/hr buy back rate by the utility.
  • Natural gas (NG) is used for the drying process; but since the cost of gas is unpredictable, we developed a payback analysis over a range of NG costs.
  • The moisture content of the sand varies between 3 and 6%.

The plant processes between 250 and 300 tph of wet sand, controlled largely by the heat available from the hot gas generator. A Caterpillar Mars 100 gas turbine, capable of producing just over 11 KWe was selected, with an available exhaust energy of 75.3 MMBtu/hr, nicely matching the dryer system needs.

Capital cost for the power plant included the installed equipment, as well as electrical switchgear to allow power to be distributed throughout the plant. Plant power needs were about 50% of the output, but a neighboring production line could easily use the remaining power.

Payback is best explained graphically. Figure 2 shows payback for the system that occurred in 4 – 5 years for gas pricing over a wide cost range.

frac-sand-dryer-to-power-generator-figure-2

Figure 2: Payback of two Caterpillar Generator models; with various fuel costs

Additionally, the heat output of the generator set was higher than the current hot gas generator, so the ability to run the dryer circuit at maximum volume was fully assured. Heat availability is better illustrated in Figure 3 where the moisture content was fully investigated.

frac-sand-dryer-to-power-generator-figure-3

Figure 3: Feed moisture and NG cost variation related to annual savings

Each plant is of course different. Some operators would love to have $0.07 KWh power; others do not operate nearly the full year, or around the clock. Some States do not mandate that utilities buy back the extra power from a co-generation plant. This is a simple application of waste heat recovery that a technical feasibility study can fully examine.

However, most mine operators are comfortable to utilize Caterpillar equipment, and Caterpillar offers their systems with complete maintenance contracts and financing. It is hard to argue with the energy efficiency of this application.

Contributors: Timothy E. Dudash and Thomas W. Hedrick

Timothy E. Dudash is a Process Engineer at PENTA Engineering Co. He has experience in the minerals industry and has spent many years commissioning mechanical systems in the western hemisphere. Feasibility, system payback analysis and optimization are his special interests.

Thomas W. Hedrick, P.E. is a Senior Project Consultant at PEC Consulting Group. He specializes in materials handling, has over 35 years’ experience in industrial projects, and holds several US patents. Mr. Hedrick writes for many magazines, but maintains a passion for excellence in client relations and project execution.

View additional feature articles under PublicationsContact Us


Selecting the Proper Lime Kiln Technology

Lime is a key industrial mineral used as a chemical additive by many industries. The industrial facilities that utilize Lime in various forms are metal ore processing, metallurgy, steel, paper, pharmaceuticals, sulfur removal, and water treatment. It is also used for generating many basic chemicals used to manufacture consumer goods.

Lime is produced through the calcination of carbonate minerals, calcium and magnesium in Rotary Kilns or Vertical Kilns.

The main types of Lime Kilns are:

Long Rotary Kilns

Main Advantages:

    • Large production volumes
    • Wide range of feed sizes
    • Medium to high reactivity Lime
    • Low sulfur Lime
    • Flexibility in fuels used
    • Production not affected by limestone decrepitation
    • Can use high sulfur coal and petcoke

Main Disadvantages:

    • High CAPEX
    • Highest OPEX (high energy usage)
    • Contact cooler may not be applicable if product is very fine
long-rotary-kiln-southern-peru-copper
Long Rotary Kiln (Southern Peru Copper).
Long rotary lime kiln

Long Rotary Kiln (Courtesy of alibaba.com).


Preheater Rotary Kilns

Main Advantages:

    • Large production volumes
    • Wide range of Limestone feed sizes
    • Medium to high reactivity Lime
    • Fuel flexibility

Main Disadvantages:

    • Limestone decrepitation can cause “plugging” in the preheater
    • High CAPEX
    • OPEX higher then shaft kiln
    • Low fuel efficiency of rotary kilns
    • Cannot use high sulfur coal and petcoke for steel customers
preheater-rotary-kiln
Rotary Kiln Preheater.
Blue Circle-lime-kiln-preheater-metso

Rotary Kiln Preheater (Courtesy of Metso).


Single Shaft Vertical Kilns

Main Advantages:

    • Low CAPEX
    • Short Schedule
    • Competitive fuel efficiency

Main Disadvantages:

    • Low production volumes
    • Will not work if Limestone decrepitates
    • Limited Limestone feed range
    • Low Lime reactivity
vertical-shaft-kiln-newmontgold

Single Shaft Vertical Shaft Kiln (Newmont Gold).


Annular Shaft Kilns

Main Advantages:

    • High concentration of CO2 in off-gas for use in further chemical processes
    • Good fuel efficiency
    • No need to wash limestone feed
    • Capable to adjust Lime reactivity production levels
    • Effective in producing dead-burned lime

Main Disadvantages:

    • Limited production volumes
    • Will not work if Limestone decrepitates
    • Limited Limestone feed range
    • Limited Lime reactivity
annular-shaft-kiln-fercalx

Annular Shaft Kiln (Courtesy of Fercalx).


Parallel Flow Vertical Shaft Kilns

Main Advantages:

    • Best fuel efficiency of all Lime Kilns
    • Capable to produce medium to very high reactivity Lime

Main Disadvantages:

    • Will not work if Limestone decrepitates
    • Limited range of feed sizes
regenerative-dual-shaft-kiln-maerz

Parallel Flow Vertical Shaft Kiln (Courtesy of Maerz).


The decision on the technology to be used is based on many factors, including the desired product characteristics, limitations of the geographical area, fuel properties and cost, etc. Some of the most important aspects to be considered are:

  1. Market (Lime use): Lime reactivity (low, medium or high) and sulfur contents are common specifications that depend directly on the technology used.
  2. Availability of Limestone resources and industry capability to manage large amounts of fines:Rotary kilns allow kiln feed size variations. This allows utilizing the smaller stone particle [down to ¼” (6mm)] generated in mining, crushing and screening; hence, increasing the mine’s life.
  3. Physical Properties of the Limestone and Lime: Although the fuel efficiency of vertical kilns is much higher than that of rotary kilns, limestone could break down into smaller pieces during calcination due to the “decrepitation” phenomenon which clogs vertical kilns, making the process not feasible. Likewise, the lime created during the calcination process should have sufficient physical strength to carry the weight of the limestone bed in the kiln.


LIME INDUSTRY– PEC Consulting Group’s Active Participation

PEC Consulting Group has provided technical assistance to industries and processing facilities that benefit from the use of lime. In doing so, we have actively helped industries meet the ever increasing demand for the production of quality lime. Sample Scopes of Work have included:

  • Feasibility and Technical Studies for Greenfield lime production facilities
  • Technical Studies for capacity increase of existing plants
  •  Investigation of potential raw material deposits such as sea shells, travertine, and limestone through Geological exploration, core drilling programs, and testing for raw material physical and chemical properties
  •  Mining Plans
  •  Conceptual design of mine and plant
  •  Flow sheets, layouts, equipment lists and basic designs.  Basic equipment specifications. Technology comparisons of major process equipment tenders
  •  Capital cost and operating cost estimates
  •  Logistics for supplying the mine facilities
  •  Economic viability analysis of the projects

A study forms the foundation for future development and it is an absolute necessity for successfully carrying a project to completion. By delivering a well prepared and thorough study, PEC Consulting Group helps its clients achieve their desired goals and competitive edge.

Article contributed by Jorge L. Lerena

Jorge Lerena has extensive experience as a Consultant and Project Manager at PEC Consulting Group. His expertise also includes financial and economic valuation and design of industrial facilities. He has participated internationally in Brownfield and Greenfield lime plant projects, and in studies for the geological evaluation and process selection of Greenfield lime plants.

View additional feature articles under PublicationsContact Us


Cement Distribution Terminals

Cement terminals offer a reliable and low cost logistics system for the distribution of Portland cement. The first leg of distribution is done where possible by water transportation. In navigable rivers, the easiest way to build a terminal is by using river cells. In Figure 1, the cells provide proper draft for the ship or barge. Cells must be located far into the current where the hydrology study indicates proper draft in both wet and dry seasons.

cement-distribution-terminals-fig1

Figure 1: River cells are located in stream; the terminal is along the shoreline

A river cell is often a circular section built of sheet piling filled with rock. Alternate systems are driven piling groups tied together to act as good anchoring points for the vessel.

One of the river cells is oversized to accommodate a receiving hopper or a reclaiming machine. Cement is transferred to shore with a belt conveyor. The arrangement should provide enough cells for proper mooring of various ship configurations. A typical hatch ship is shown in this illustration. Generally, the first, middle and front storage has cement. The other holds are not needed for high density cement (they were intended for transporting less dense grain and similar light weight bulk products). The ship will need to move several times in order to keep proper balance if the terminal is of sufficient size to take the full ship load of cement. Recently, many of these types of ships have been outfitted with an azipod, or multidirectional thruster, which allows maneuverability in small rivers without a turn-around facility. No tugs are required for docking.

Figure 2 is an elevation view of the same arrangement. A very basic terminal would have a drive-through steel storage bin with an adjacent office. The cement is unloaded by grapple or dock-side ship unloader to the hopper, conveyed to shore and elevated to the storage bin by a bucket elevator. Self-unloading vessels are of course preferable. A shroud and dust collector is used at the hopper to capture dust from the operation and to provide for an environmentally friendly site. The elevation of the hopper and the mooring cells are determined from the hydrological study of the site.

cement-distribution-terminals-fig2

Figure 2: Elevation view of a typical river mooring and terminal location

Steel bins are most often used when the terminal storage is limited to 4,000 tons. Over 4,000 tons, generally a value engineered solution will suggest a slip-formed silo. One cell concrete silo can generally range from 4,000 to 10,000 tons. The range for a concrete dome is between 7,000 tons and 100,000 tons. Multiple silos require more mechanical devices to function, thus the cost analysis favors one large storage dome over multiple small storages. Because domes carry their bulk load close to the ground, many times they do not need deep foundations (piling) and considerable costs can be averted.

Figures 3 and 4 show a fluidized discharge hopper. When compared to Figure 3, the silo in Figure 4 has gained considerable capacity in cement storage by shifting the location of the loading spout to one side. Even though there is a slight cost of energy, it provides an attractive increase in the storage volume.

cement-distribution-terminals-fig3

Figure 3: Bin Fluidizer used to lower the hopper elevation

The arrangement in Figure 4 provides the ability to install additional loading lanes. Likewise, this could be a two-silo arrangement with the cement transferred to a drive-through truck loading silo from a larger silo closer to the ground. It is important that the designer value engineer each of these arrangements and advise the client of the best arrangement based on the site conditions.

cement-distribution-terminals-fig4

Figure 4: Fluidized bin bottom with side truck loading

Rail transportation is generally the next best option to water transport. Figure 5 illustrates a simple rail unloading system. The cement is transferred from the port or plant by rail to the distribution terminal.

cement-distribution-terminals-fig5

Figure 5: Rail unloading station associated with a steel bin terminal

The distribution of cement to new territories is a proven method to expand the market. Value Engineering has repeatedly proven that a well prepared engineering study results in a well planned solution to attending the market needs.

PEC Consulting provides the experience to assist management with lostics planning. Expanding market through distribution terminals may very well be worth the investment.

This article was contributed by T.W.Hedrick, Senior Consultant for PEC Consulting, he has been in manufacturing and engineering for 40 years, holds seven U.S. patents and has written several dozen technical papers for various magazines and conferences around the world.

View additional feature articles under PublicationsContact Us


Benefits of Plant Maintenance and Reliability Audits

Work processes and best practices that enhance equipment reliability expand realized capacity by avoiding unnecessary production interruptions. Production interruption due to lack of equipment reliability increases a unit’s production cost. In recent years, reliability engineering concepts have been adopted by process industries with the realization that significant improvements in financial performance can be achieved.

For each percentage of availability lost, facilities lose millions of dollars due to lower production capabilities. However, a small increase in equipment reliability converts to an increase in production and large increases in revenue, particularly for those products in strong demand (by the magic of incremental margins). Considering the high capital costs invested in the minerals industries, increasing reliability results in a high return on investment.

maintenance-and-reliability2

When investigated, the lost opportunities tend to fall into one of three categories:

  1. Less than optimum work processes
  2. Human error
  3. Equipment faults

As a prudent defense, management must commit to training, improving work processes, evaluating equipment operations and documenting maintenance histories to determine improvement opportunities.

Typical results of an effective Enterprise Reliability Strategy include a 10% – 15% reduction in conversion cost accompanied by an 8% – 15% increase in real production capacity, with no significant capital investment in production equipment.

As capital-intensive industries around the world grapple with developing successful strategies for improved reliability, pacesetter companies have forged ahead of others by developing and implementing an Enterprise Reliability Strategy bringing with it these tangible benefits:

  1. Accurate analysis of equipment maintenance, repair, and replacement records. Decisions become data driven rather than “reflex”. That’s not so say that a seasoned EAM (Enterprise Asset Management) team does not attain “unconscious competency” as the methods become second nature.
  2. Increased availability of production systems and equipment yield more product at incremental cost rather than diluted cost.
  3. Fewer failures of production systems and equipment, resulting in fewer unplanned outages. Repairs flow with improved efficiency and effectiveness. Crews deal with equipment on the company’s terms rather the equipment’s terms. Callouts and overtime are eliminated.
  4. Improved product quality and an associated reduction in energy, material and labor costs related to losing or reprocessing product.  Fewer start-ups and cool downs reduce waste or off-spec product. Processes “flat line”.
  5. Reliable equipment and histories, betters MACT, environmental, and MSHA compliance. Reliable equipment reduces insurance premiums.
  6. Lower costs for system and equipment maintenance, spare parts inventory, and capital replacement. Rework is reduced.
  7. Enhanced morale among management and the work team as they learn to enjoy a proactive environment instead of surviving in chaos. Employees are empowered to make a difference and see professional reward from their efforts.
  8. Additional real capacity as operating units are able to operate at higher levels for sustained periods without excessive equipment failure, perhaps avoiding capital expansion.
  9. Higher profits from the compounded effect of reduced conversion costs and increased output.

The competitive advantage will be to the player that can deliver its full capacity reliably, on time, with a quality product that meets the customer’s expectations.

Maintenance and Reliability – PEC Consulting’s Value Proposition

PEC Consulting has provided comprehensive Maintenance and Reliability Audits to mineral processing facilities identifying critical aspects which prevent plants from increasing their capacity and maximized competitiveness. We have provided recommendations and action plans to bring each plant to a World Class / Best in Class Maintenance facility.

We can analyze your Maintenance and Reliability management systems, preventive and predictive systems, organizational structure and staff, methods and procedures to benchmark and score your maintenance systems against industry best practice standards, making the appropriate recommendations for improvements, with follow-up audits to help with the implementation process.

Main feature contributor: Ken Rone, Senior Consultant


View additional feature articles under PublicationsContact Us


Waste Heat Recovery for Power Generation

Hot process gases that are vented to the atmosphere by a Process Plant represent a potential for the generation of electric power. The installation of a Waste Heat Recovery (WHR) System is a “green” option that must be considered.

Typical-WHR-system

The Waste Heat Recovery (WHR) System consists of a steam generation unit and a power generation unit. The steam generation unit is a set of boilers placed in the path of the waste gases. The heat in the gases, sometimes supplemented by additional heat in the co- generation process, is used for generating steam. The steam can be used for other process requirements within the industrial plant, or used for driving a turbine that is connected to the generator. The generated power can either be used for running plant equipment or fed back to the power grid.

The recovered waste heat represents “green energy” since it is a direct savings in the use of fossil fuels with the consequent reduction of carbon dioxide emissions. Furthermore, cooling of the process gases is done without wasting scarce water or diluting with ambient air that would increase the energy consumption of the fans.

Several challenges exist, such as sticky and abrasive dust in the gas, or corrosive vapors such as SO2. The boiler must be custom-designed carefully to handle the specific characteristics of the off-gases. In special cases, like when there is a low gas temperature, an Organic Rankine cycle can be chosen instead of the steam cycle. The recovered waste heat represents “green energy” since it is a direct savings in the use of fossil fuels with the consequent reduction of carbon dioxide emissions. Furthermore, cooling of the process gases is done without wasting scarce water or diluting with ambient air that would increase the energy consumption of the fans.

waste-heat-recovery-India

PEC Consulting’s feasibility studies evaluate the characteristics of the process plant’s off-gases and assess the quantity of heat that can be usefully recovered. PEC Consulting will evaluate space limitations and find a solution to place the boilers and power generation system and integrate new equipment with the existing. PEC Consulting’s feasibility studies provide the client with an assessment of the power potential, a financial analysis with capital and operating cost estimates, and a layout to integrate the Waste Heat Recovery System with the existing process plant.

Waste Heat Recovery (WHR) Systems help process industries to become part of the green revolution by conserving natural resources. In addition to providing a reliable electrical supply, the reduction of the carbon footprint helps the environment. A co-generation plant is also a great benefit when the power grid supplying the plant is unreliable or when the plant is subject to interruptible power.

PEC Consulting can help the process industries with the realization of this noble and profitable goal.


View additional feature articles under PublicationsContact Us

The Importance of Lime

Lime is one of the oldest and most important chemical products. Today it is equally significant to the economy of industrial processes. It is extensively used in mining of raw metal ores. Other industries utilize lime in their processes to remove or neutralize hazardous emissions. Its use brings well-known efficiencies and solutions that benefit the mining of raw metal ores and protect the environment.

featured-industry-lime

Lime is used in the production of steel in basic oxygen furnaces. In non-ferrous metallurgy, lime is used in copper, gold, and silver recovery. Lime is used to process alumina and magnesia, and to recover nickel by precipitation. Tailings that result from the recovery of precious metals, such as gold and silver, are treated with lime for environmental remediation purposes. It is used for softening municipal and plant process water and sewage treatment. In power plants and industrial plants, lime is injected into the flue gas to remove acidic gases. Hydrated lime may be used to control sulfur trioxide emissions at utility power plants. Lime is used by the pulp and paper industry and the chemical industry; it is used in sugar refining, in road paving, and in construction. Dead-burned dolomite, also called refractory lime, is the primary form of lime used in refractories.

LIME INDUSTRY– PEC Consulting Group’s Active Participation

PEC Consulting Group has provided technical assistance to industries and processing facilities that benefit the most from the use of lime. In doing so, we have actively helped industries meet the ever increasing demand for the production of quality lime. Sample Scopes of Work include:

  • Feasibility and Technical Studies for Greenfield lime production facilities
  • Feasibility and Technical Studies for capacity increase of existing plants
  • Investigation of potential raw material deposits such as sea shells, travertine, or limestone to be used as a source for quick lime
  • Geological exploration, core drilling programs, and testing for raw material physical and chemical properties
  • Mining Plans
  • Conceptual design of the mine and the plant
  • Equipment Selection. Flow sheets, layouts, equipment lists and basic designs.  Basic equipment specifications. Technology comparisons of major process equipment tenders submitted by equipment OEMs
  • Capital cost and operating cost estimates of the project
  • Logistics for supplying the mine facilities
  • Economic viability analysis of the project

A study forms the foundation for future development and it is an absolute necessity for successfully carrying a project to its completion. By delivering a well prepared and thorough study, PEC Consulting Group helps its clients achieve their desired goals and competitive edge. The efficient extraction of minerals and ores and how lime plays an important part in these processes is our specialty and expertise.


View additional feature articles under PublicationsContact Us


Evaluation of Buildings and Structures for Heavy Industrial Plants

Condition Assessment of Structural Components of an Industrial Process Plant

The structural condition assessment of buildings and structures of an industrial process plant is essential to the prevention of major problems involving the safety of the workforce, significant maintenance costs, environmental pollution, and production losses. A structural failure increases the risk of injury to plant personnel, and depending on the kind of structure and its function, it can lead to complete shutdown of the plant’s operations.  An evaluation prevents unexpected failures, provides a cost-effective solution to maintenance, reduces the risk of injury and life loss to plant personnel, puts the future operating time of the plant in condition of assured reliability, and it could increase the life of the plant’s equipment.

Services

The expanse of our services covers the following:

figure-1 evaluation-of-buildings-and-structures vehicular-impact-damage– Site visit to the Plant  to visually inspect the condition of buildings, silos and main structures which could present detected or undetected  structural problems, such as: cracks, delaminations, settlements, elements in risk to fall, vibrations, high corrosion, high deformations.

– Review in more detail the technical information of buildings and structures: Construction drawings, specifications, calculations and local codes.

– Perform material testing to certify the quality of the construction materials.

– Diagnose the problems and, in some cases, provide preliminary recommendations to reduce the risk of failure while a more deep analysis is underway.

– Prepare a techno-economical report indicating the cause(s) of the problem, alternatives and recommendations for the most appropriate solutions.

Figure 1: Vehicular Impact Damage

figure-2 evaluation-of-buildings-and-structures differencial-settlement-solutions– Provide basic engineering based on our recommendations: drawings, specifications and calculations.

– Supervise implementation of our recommended solutions to guarantee the problem has been solved.


Figure 2: Differential Settlement Solutions

Facilities and Components

figure-3 evaluation-of-buildings-and-structures integrity-verification– Steel and Concrete Industrial Building and Structures

– Concrete and Steel Silos

– Material Storage: Domes, Bunkers, Longitudinal Storage, Bins, etc.

– Foundations for vibrating equipment: Mills, Fans, and Crushers, etc.

– Galleries, Trusses and Bents for Belt Conveyor support

– Tunnels and Retaining Walls

– Maritime Facilities: Jetties, Docks, Piers and Dolphins

Figure 3: Integrity Verification; Spalling repair

Common Problems

figure-4 evaluation-of-buildings-and-structures buckling-failure– Cracks and delamination in Concrete Silos

– Buckling deformation on steel silo walls

– Dust and material accumulation in roofs

– Durability problems: high degree of corrosion of steel structures or concrete reinforcement, concrete delamination, old structures deterioration


Figure 4: Buckling Failure

figure-5 evaluation-of-buildings-and-structures roof-buildup-failure– Settlement of buildings and structures

– Stability problems in buildings and structures.

– Overstressed Beams or Columns, which show high deformations

– High Vibrations in foundations for vibrating equipment

– Loads or conditions not considered in the original design

– Modifications made to structures without an analysis

Figure 5: Roof Buildup Failure

figure-6 evaluation-of-buildings-and-structures buildup-in-belt-conveyorThe various operating conditions, age of the plant, errors in the original design of an industrial plant lead to structural changes, which may also lead to costly and in some cases irreparable conditions. PEC Consulting provides comprehensive structural evaluation of industrial processing facilities, both preventative and remedial. This service is offered by our highly- experienced, specialized consultants who will visit the plant, find the problems at incipient stages, prepare a comprehensive report which cause intervention prior to failure, and make sure that your problem is solved.

Figure 6: Dust Buildup in a Belt Conveyor


Main feature contributor: Roberto Jimenez

View additional feature articles under PublicationsContact Us


Bulk Materials Storage Covers

The degree of sophistication of bulk materials storage product lines has increased considerably. Bulk storage is progressing from unfettered outside storage to covered structures; a more contained exposure to the environment. Fabric, steel, and concrete structures represent the environmental envelope over bulk materials.

Fabric Bulk Storage Structures


Figure_1_-_2008_1107_Consolidated_G_B_Scott-City_MO_16The structure is minimal, following the grain angle of repose. It is adaptable for various grain characteristics. For example, if the angle of repose were higher, the amount of skirt fabric overhang would be reduced. The retaining wall on the edge is fabricated with galvanized metal and functions as an integral part of the aeration system. As the grain is reclaimed, sections of the retaining wall are removed and the end loader has as much access as it is allowed by the removed sections.

Figure 1 – Fabric Covered Grain Storage

Figure_2_-_Edge_retainging_structure

The center stacking column has a fan system that continuously sucks air through the bulk storage. The air is drawn through the peripheral retaining sections to the center column and exhausted. The negative pressure holds the fabric against the stored material, keeping the fabric from “flapping”.There is an elaborate anemometer system on the column that increases the negative pressure according to wind speed. Note that when the wind exceeds 40 mph (64 kph), a crew is required to monitor the stability of the fabric.

Figure 2 – Edge Retaining Structure

Figure_3_-_Urea_Tripper_Building_with_fabric_cover

Another type of fabric structure consists of an arched structural frame over a conventional tripper conveyor (with a tunnel reclaim belt conveyor). Figure 3 shows a urea storage fabric structure draped over the steel frames. Since the building is held under negative pressure, the entry is an airlock structure.

This particular building was on a high water table. The center tunnel concrete structure enclosed the withdrawal belt tunnel and provided the structural support for the tripper conveyor support bents. The fabric support structure has an independent foundation. The owner used an asphalt floor between the tunnel and the building perimeter.

Figure 3 – Urea Tripper Building with Fabric Cover

Figure_4_-_Air_Supported_Structure

Figure 4 shows a classic air supported structure. This structure was over a swimming pool; however, these types of structures are feasible for bulk materials storages.

Only the inflation fans provide rigidity to this structure. For industrial applications, large air-lock entries and backup power supply for the blowers are mandatory.


Figure 4 – Air Supporter Structure


Metal Rectangular Bunkers

Figure_5_-_Foreground_outside_tripper_conveyor_background_metal_structure

Figure 5 shows one of the most common and traditional bulk storage arrangements. There is an outside tripper conveyor in the foreground. A metal structure with a tripper conveyor in the gallery is in the background. The product is elemental sulfur, which in most locations would not be a candidate for outside storage. This particular facility is in the Port of Dakar, Senegal, Africa.


Figure 5 – Foreground: outside tripper conveyor. Background: metal structure for inside storage

Figure_6_-_Inside_a_metal_bunker_building

Figure 6 shows how a typical bunker building looks inside. A tripper conveyor distributes the bulk material. Under floor tunnel or tunnels are used to reclaim material.

Note that under-grade reclaim tunnels typically claim less than 1/3 of the storage volume. The majority of the stored material must be repositioned by dozer over the static reclaim positions. This work is done in an inhospitable environment for both the equipment and the operator.

The venting volume to keep the dust from escaping outside the building is uneconomical with the door open. Figure 6 – Inside a Metal Bunker Building

Figure_7_-_Retaining_wall_with_counterfort

To increase the amount of reclaimable material, often the metal building is constructed with concrete retaining wall sides. Figure 7 shows a 3-meter high wall reinforced with a counterfort. This is an effective way to increase the depth of material. Typically, retaining walls taller than 3 meters are not economical.


Figure 7 – Retaining Wall with Counterfort


Steel Space Truss Domes

Figure_8_-_Space_truss_storage_dome_over_a_circular_stacker_reclaimer

Figure 8 shows a typical reclaimer in a Space truss style dome. Circular stacker / reclaimers are very popular mechanical devices since they can be used for blending the material fed into the storage. The reclaimed volume is generally 100%. A “rake” reclaimer further develops the overall product mix. A popular cover is the steel space truss.


Figure 8 – Space Truss Storage Dome over a Circular Stacker/Reclaimer

Figure_9_-_Space_truss_dome_shell_over_a_blending_stacker_reclaimer

Figure 9 actually shows the truss under construction, with the aforementioned “rake” over the reclaim bridge.


Figure 9 – Space Truss Dome Shell over a Blending Stacker/Reclaimer

Figure_10_-_Linear_Storage_blending_system

Figure 10 shows an example of a portal stacker/reclaimer , which is a common type of linear blending system.

The typical cover for the linear storage is a frame type steel structure with metal cladding. It can be either a space frame or, in shorter spans, a conventional A-Frame.


Figure 10 – Linear Storage Blending System


Concrete Shell Storage Structures

Figure_11_-_Circular_stacker_reclaimer_inside_a_concrete_dome

Concrete shells offer one more degree of containment. Typically, they are very economical retaining structures. When used with a circular storage / reclaimer such as inFigure 11, the shell can support the bulk load to considerable heights.

The coal inside this 300 foot (91 m) diameter dome was stacked 55 foot (17 m) high against the shell.


Figure 11 – Circular Stacker Reclaimer inside a Concrete Dome

Figure_12_-_White_Exterior_coal_storage_dome

Figure 12 is an exterior photo of the same coal storage dome in Figure 11. The environmentally conscious Owner chose a white exterior for Powder River Basin Coal.

Earlier, it was noted that an open pile has less than 33% live storage (a pile with a central tunnel). Using the attractive structural cost of concrete dome construction, a couple of tunnels and a tall dome can increase the live storage well over 85%.

Figure 12 – White Exterior, Coal Storage Dome

Figure_13_-_Cement_clinker_stored_inside_shell_with_4_tunnels

In Figure 13, the concrete shell is designed to hold 200,000 t of cement clinker. The high percentage of gravity reclaim is possible because of the cylinder section under the hemispherical shell. During the feasibility studies, the project cost was optimized. The dome shell is more expensive, but there is no mechanical reclaim, just reliable gravity.


Figure 13 – Cement clinker stored inside this shell, with 4 tunnels, is over 85% gravity reclaim


PEC Consulting has significant expertise in bulk materials handling and storage. We can analyze your bulk storage requirements and advise you on the pros and cons of the various choices. We team each system with the most advantageous loading and reclaim system and evaluate the results. We offer the up-front studies that allow you to choose the best technical, environmental and economical solution for your application.

Main feature contributor: Thomas W. Hedrick, P.E.

View additional feature articles under PublicationsContact Us


Developing Frac Sand Quarries

Silica sand is one of the most abundant minerals on the Earth’s crust. However, not any sand will work for gas and oil extraction. The industry is looking for specific gradations of sand between 1.2mm and 0.2mm. This sand should be clean, well rounded and have a Mohs hardness near 7.

Hydraulic fracturing is a key method of extracting unconventional oil and gas resources. As a rule, formations of shale gas resources have lower permeability than conventional gas formations and therefore, depending on the geological characteristics of the formation, specific technologies, such as hydraulic fracturing, are required. Although there are also other methods to extract these resources, such as conventional drilling or horizontal drilling, hydraulic fracturing is one of the key methods making their extraction technically viable. The multi-stage fracturing technique has facilitated shale gas and light tight oil production development in the United States and is believed to do so in the other countries with unconventional hydrocarbon resources. Significance of the extraction of unconventional hydrocarbons lies also in the fact that these resources are less concentrated than of conventional oil and gas resources.

The technique of hydraulic fracturing is used to increase or restore the rate at which fluids, such as natural gas, can be produced from subterranean natural reservoirs. Reservoirs are typically porous sandstones, limestones, or dolomite rocks, but also include “unconventional reservoirs” such as shale rock and coal beds. Hydraulic fracturing enables the production of natural gas and oil from rock formation deep below the earth’s surface (generally, 5,000 – 20,000 feet). At such depth, there may not be sufficient permeability or reservoir pressure to allow natural gas and oil to flow from the rock into the wellbore at economic rates. Thus, creating conductive fracture in the rock is pivotal to extract gas from shale reservoirs because of the extremely low natural permeability of shale. Fractures provide a conductive path connecting a larger volume of the reservoir to the well. So-called “super fracking”, which creates cracks deeper in the rock formation to release more oil and gas, will allow companies to frack more efficiently.

Source: Hydraulic fracturing – Wikipedia, the free encyclopedia.http://www.wikipedia.org

frac-sand-quarries-feature-article-photo1

Figure 1: Frac Sand Quarry, after blast

Figure 1 shows a sandstone deposit in mid-Texas, typical of high-quality raw materials. The deposit has approximately 30 meters of overburden. The sandstone is mined, crushed and pre-graded, washed in attrition mills to further liberate the unwanted particle size both hydraulically and with vibrating screens.

The process may yield only 25% usable sand. The wet processing includes the removal of the clays and fine silica. After wet processing, the sand is dried, mechanically screened and separated into specific gradations appropriate for fracing.

Water is needed to liberate the fines. On-site water recovery, water management, clarifier and retention ponds are required. Mine permits, quarry plans, core analysis, logistics for the operations are necessary. Air quality, highway access, and use permits are all part of project development.

The frac sand user, the petroleum well driller, needs about 3,000 tons per well of sand. The driller mixes sand with other ingredients and water and injects the slurry into the well at about 50,000 psi pressure. A continuous high quality source of sand is imperative to obtain the maximum yield from the gas/oil bearing shale.

After the sand has been dried and screened, various 4 gradations of frac sand will be ready for transport to the drill site. The operation runs 24 hours per day, 7 days per week and may provide millions of tons of sand per year to customers. Logistically, this means that hundreds of pneumatic tankers of sand will be loaded, sampled, tested and released to customers each day.

To the quarry, it means that for every 5 million tons of sandstone processed each year, the mine operator must handle 3 million tons of sand tailings with reclaiming and revegetation plans.

PEC Consulting helps owners benefit from thorough planning. Our consultants have years of experience designing and operating quarries and logistics systems. We have qualified miners, engineers, materials handling experts, layout professionals and planners. Have us conceptualize and develop your deposit in this fast-growing field.

frac-sand-quarries-feature-article-photo2


frac-sand-quarries-feature-article-photo3

Main feature contributor: Thomas W. Hedrick, P.E.

View additional feature articles under PublicationsContact Us


Cement Industry – Plant Process Audits

Contact Us » icon-contact2x

A Plant Process Audit is a comprehensive evaluation of the overall performance of the plant’s operations. PEC Consulting systematically evaluates the plant’s operations, identifies the areas that are not working efficiently, and presents its findings and solutions to optimize the plant.

plant-process-audits

Steps for Process Audits

  1. Benchmarking

    Modern, dry-process cement plants with efficient configuration of grinding and pyro processing systems typically consume less than 700 kcal/kg-cl thermal energy and 100 kWh/mt of electrical energy. Older plants have inefficient systems, which compounded with operational and maintenance inadequacies, tend to have much higher energy consumption. Based on the plant’s conditions and specific requirements, general benchmarking is done to set targets. Plant audits evaluate the operation of a cement plant against the appropriate benchmark. After a detailed evaluation, recommendations for plant optimization are made in three levels of capital investment:

    Step 1: None or very little capital investment — by making adjustments to the operational protocols and improving maintenance
    Step 2: Minor capital investments – with payback within 24 months.
    Step 3: Major capital investments – with 3- to 5-year payback.

  2. Historic Evaluation

    The plant operational and stoppage data is collected over the past two or more years. The reasons for the stoppages are analyzed in terms of category (mechanical/electrical/instrumentation/refractory/other), duration, and frequency in order to identify causes in order of severity.

    The plant performance is also analyzed by department. Often a department’s best performance does not occur at the same time of the best performance of the plant as a whole. If we choose the best performance times of each department and make them occur at the same time, the plant performance would show a considerably higher level of efficiency. Attempts are made to make them happen at the same time, which is not an unrealistic target as the departments had indeed performed at that level in the past.

    Through a systematic approach, all departments are made to perform at the highest possible level thus increasing the plant’s overall productivity.

  3. Thermal Energy

    Thermal energy relates to the Pyroprocessing system. For a 1 million mt/year clinker production, savings of 10 kcal/kg-cl would result in annual savings of approximately $185,000.

    (1,000,000 tpy*1,000 kg/y*10 kcal/yr * $120/t-coal
    (6,500kcal/kg-coal/1,000 t coal)

    Another significant advantage in most cases is that the reduction in heat consumption can be utilized to increase production.

    Potential savings can also be derived from:

    • Cooler optimization
    • Arresting in-leakages
    • Optimization of operational strategy
  4. Electrical Energy

    Large fans and mill drives are major consumers of electrical energy.

    Fans — fan power is linked to specific heat consumption and many operational parameters. Optimization of these parameters will help lowering fan power consumption.

    Mills – in the case of ball mills, optimization of the mill charge and upkeep of the mill internals will minimize power consumption. As for vertical roller mills, the inspection of mill internals and separator, and adjustments in the operation will bring about improvements, both in energy consumption and production increase.

  5. Chemistry and Operations Strategy

    Clinker quality related issues are addressed by evaluating the chemistry and operational parameters.

  6. Emissions management

    The inadequacy of emission management systems generally found in older plants do not meet current emission regulations. PEC Consulting can analyze emission levels and provide solutions to improve emission management.

PEC Consulting Group’s Active Participation in the Industry

PEC Consulting Group has experienced staff to undertake Plant Process Audits and provide ongoing technical assistance to cement plants to improve operational performance. The scope of work generally includes:

  • Plant visit and discussions with the plant’s operating personnel
  • Data collection of historical stoppages and operating parameters
  • Analysis of the data to identify areas for improvement
  • Submission of a report providing observations and recommendations, including economic analysis to establish the cost/benefit ratios.
  • Develop with the Plant Management an implementation program.
  • Work with Operating personnel through periodic goal-setting and audits until the prescribed performance goals are achieved.

A Plant Audit is the foundation to optimize the plant operations and often presents the lowest cost/benefit investment ratio.

Please contact fbenavides@penta.net for specific applications where we could be of service.

View additional feature articles under PublicationsContact Us