These were the postings that were originally featured on the publications page.

Options for Grinding Slag and Pozzolan for use as Construction Materials

By Russell Reimer and Francisco M. Benavides

While the use of supplementary cementitious materials is increasingly popular, the use of granulated blast furnace slag and pozzolans presents extra challenges to the grinding process. A careful assessment of grinding options available is key to efficient grinding operations.

The increasing pressure to use supplementary cementitious materials (SCMs) favours granulated blastfurnace slag (GBS) and pozzolans. However, these materials present high levels of moisture and abrasiveness, requiring grinding systems designed to deal with these properties. Therefore, it is important to evaluate which grinding system best serves the purpose.

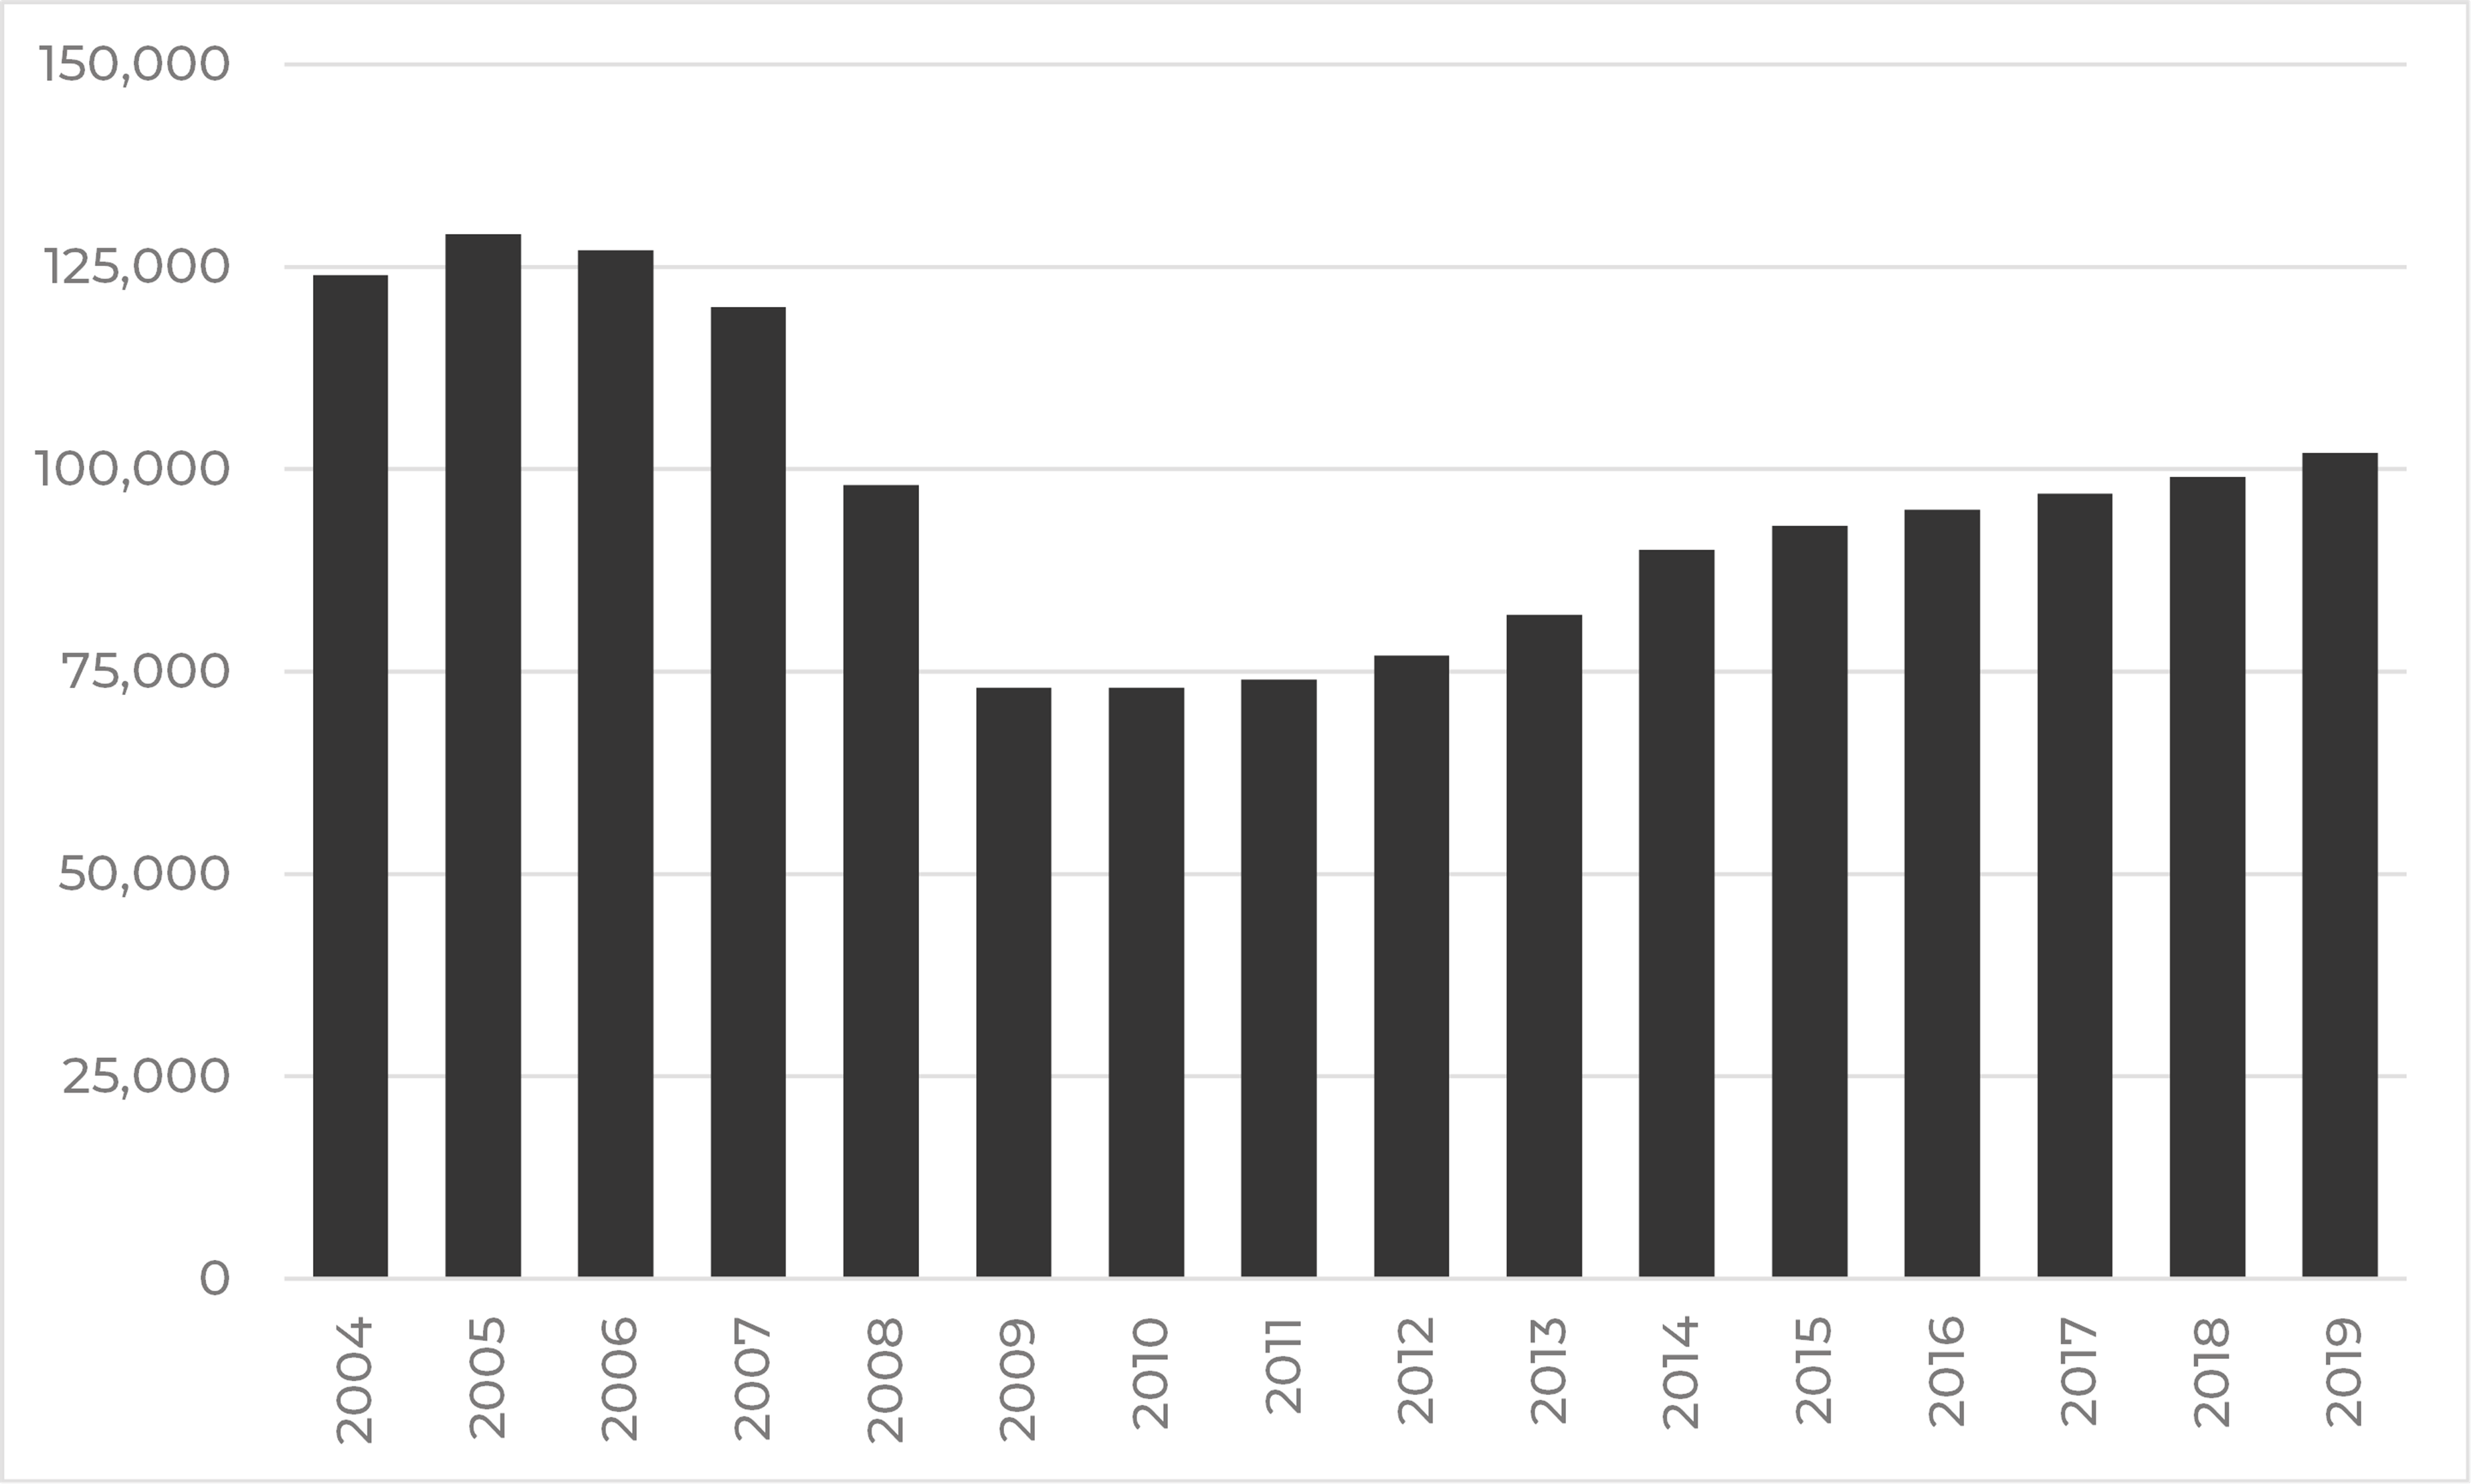
GBS is a byproduct of steel manufacturing, mostly consisting of CaO, SiO2 , Al2 O3 and MgO, with CaO and SiO2 composing the largest share. Lesser components like Fe2 O3 comprise the rest. As the number of blastfurnaces has decreased in steel manufacturing and are mostly located in the in the northeast and midwest USA, many US cement manufacturers import slag. The main benefit of slag cement (Type IS) is the effectiveness in mitigating alkalisilica reaction (ASR) by binding alkalis in the concrete hydration reaction.1 Some cement mixes can be made without clinker, furthering the usefulness of GBS in reducing CO2 emissions.

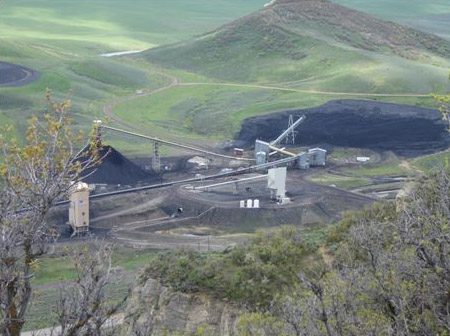
Pozzolanic materials such as volcanic ash or pumice, calcined kaolin, fly ash and diatomaceous earth are reactive aluminosilicates. Fly ash is the easiest to access from storage areas at coal-fired power plants. However, due to the closure of coal-fired power plants, this resource is dwindling. 

1. Comminution Overview

Comminution theory focusses on the relationship between energy input and the particle size produced from a given feed size.2 The most common breakage methods are impact and attrition, mostly by ball mills. This compares with the compression mechanism, as well as attrition, utilised in both high-pressure grinding rolls (HPGRs) and vertical roller mills (VRMs). The Bond Ball Mill Work Index (BBMWi) is widely used to measure the grindability of a mineral in kWh/t.2 In reference to clinker grinding, the following are typical energy requirements:1

    • Ball mill: 38kWh/t.
    • HPGR plus ball mill: 30-34kWh/t.
    • VRM: 28-32kWh/t.

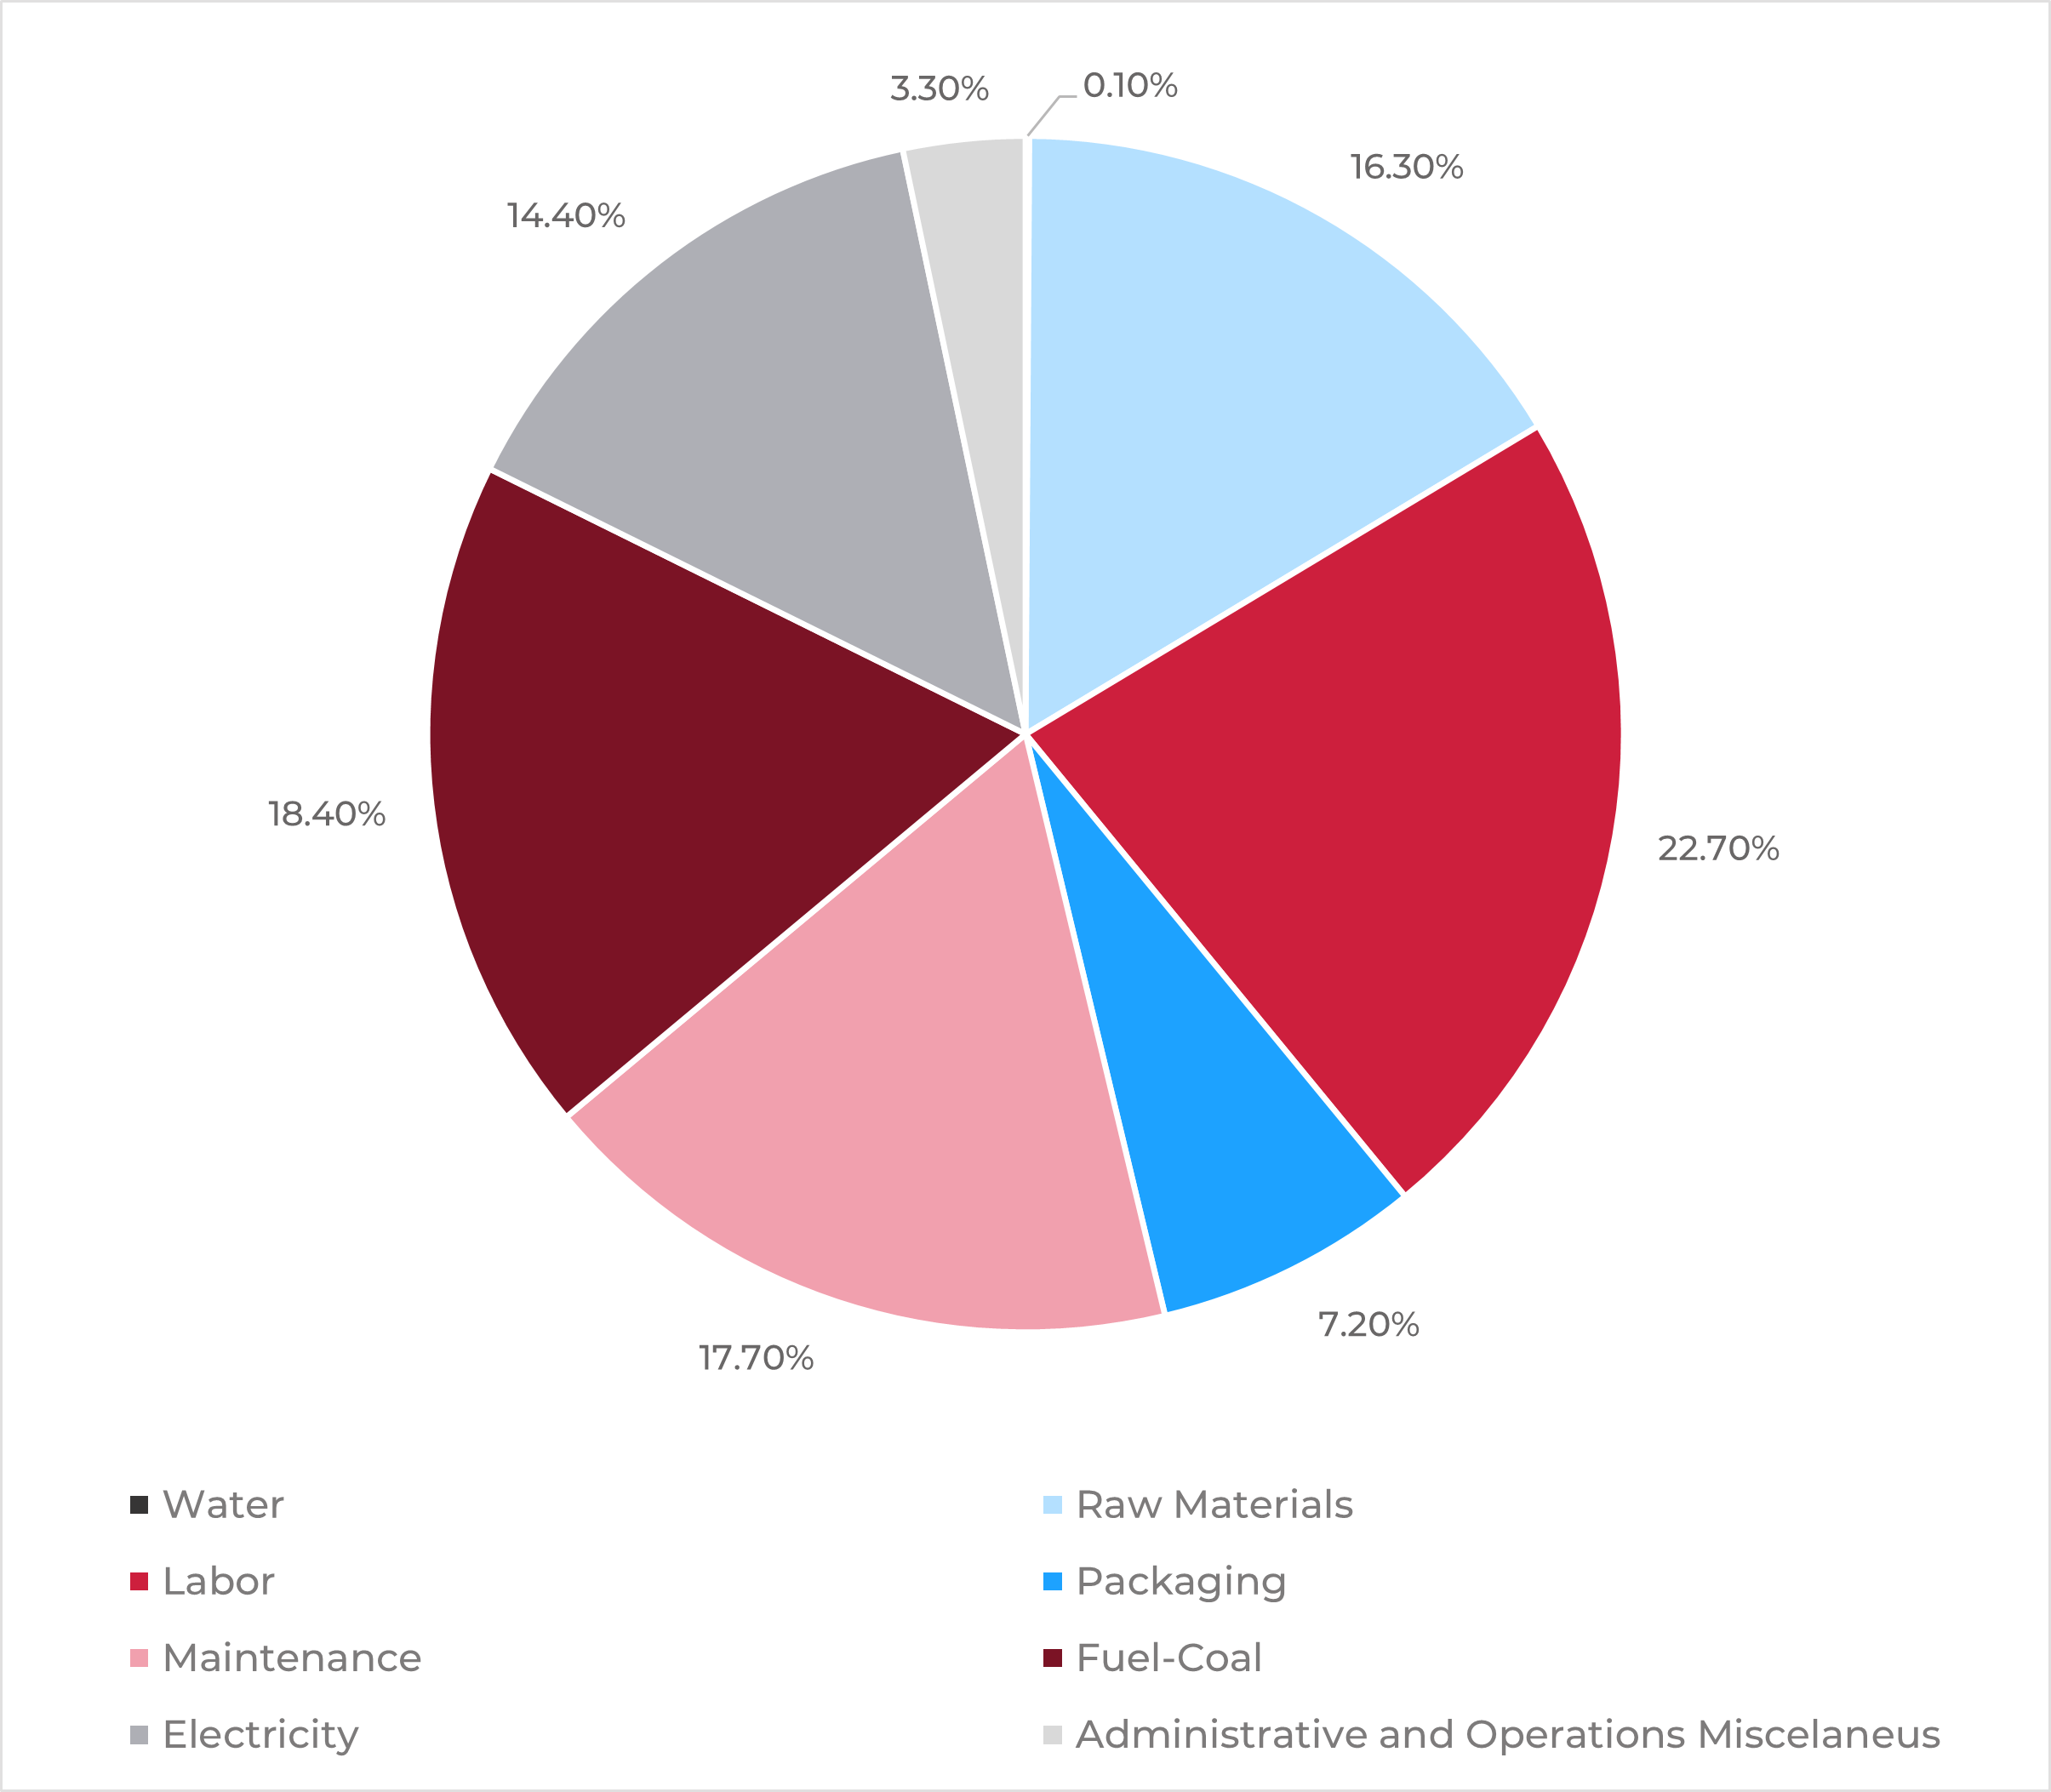
Grinding is a very energy intensive process that accounts for a significant amount of production costs.7 This is why advances in classifier technology have been vital in increasing production efficiency. Since GBS and pozzolan require a large surface area for reactivity, the fineness of the ground material plays a critical role, thus the efficiency of the classifier is essential.

2. Drying Methods

Minerals to be processed may have a high initial moisture content (see Table 1), but undercover storage can reduce moisture before entering the grinding process. If moisture levels are too high for mills to grind at reasonable production levels, drying is required ahead of the mill. VRMs are more suited for drying compared to other types of mills. A VRM can grind and dry minerals with 15 per cent moisture.5 

Table 1. Typical Properties of Feed Materials

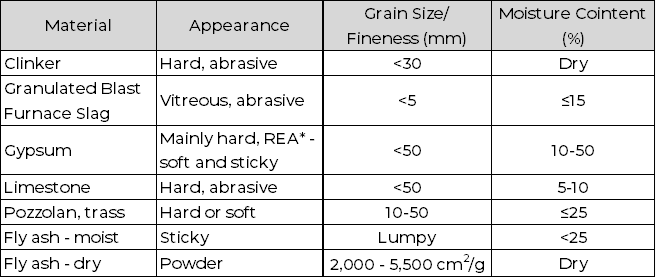
Note. *Gypsum from the flue gas desulfurization plants. Adapted from LOESCHE (2016) Loesche Mills For Cement and Granulated Blast Furnace Slag E 2016. Düsseldorf, Germany: Loesche, 27p.

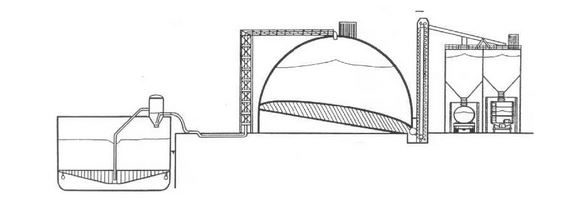
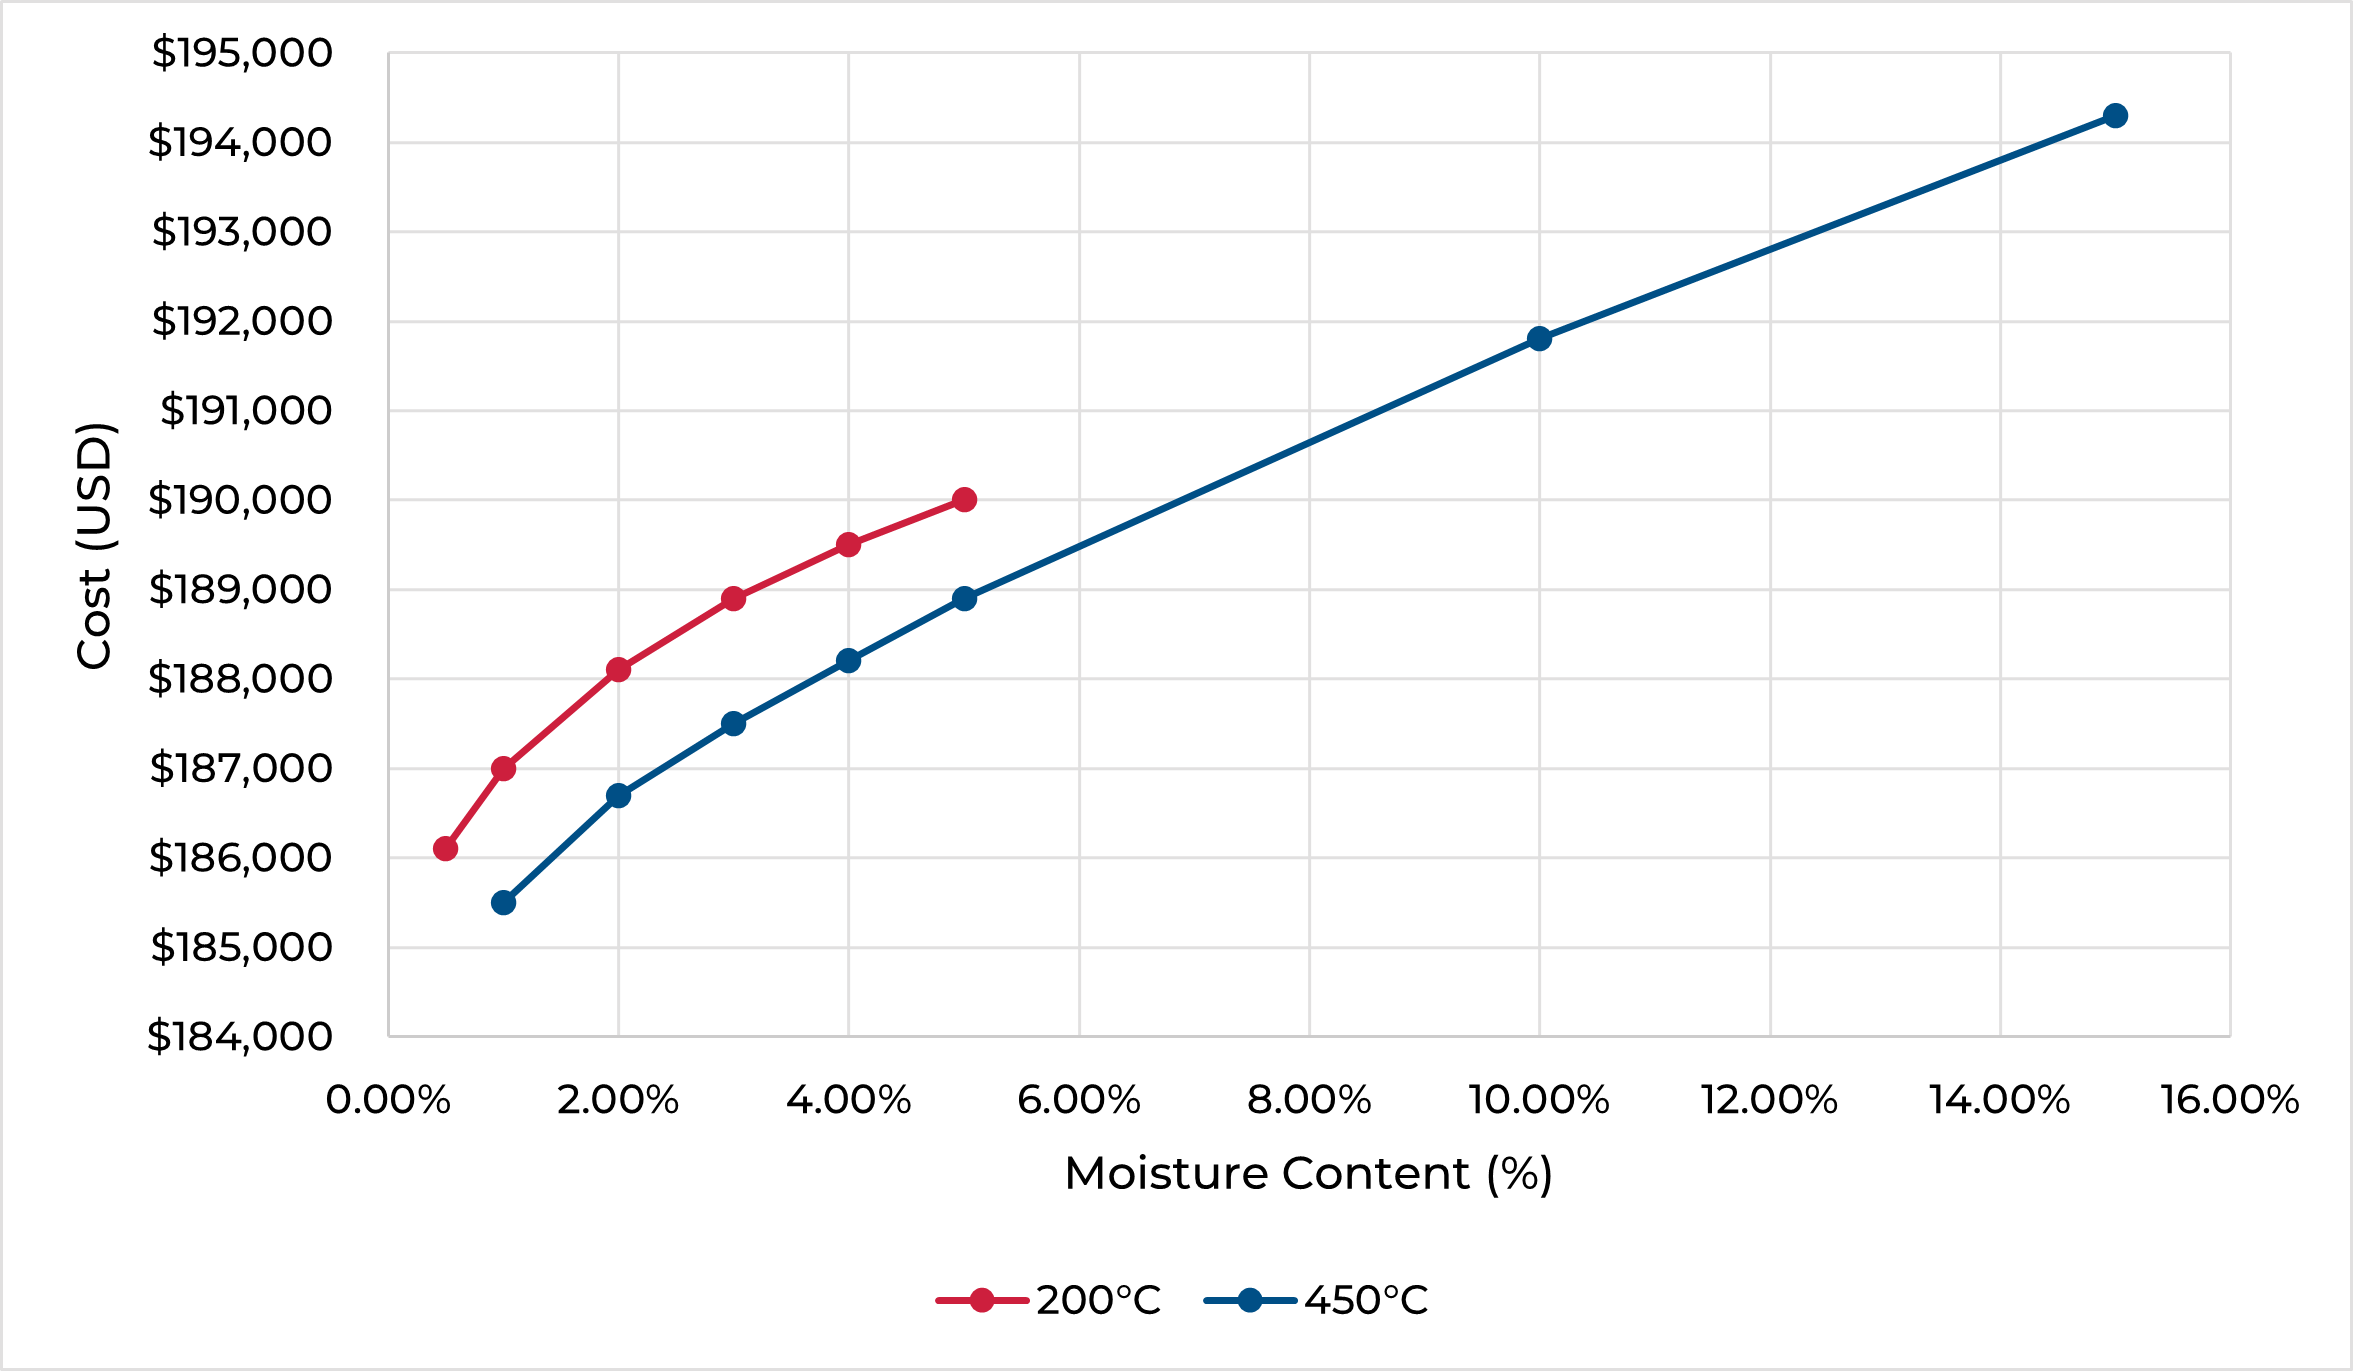
A ball mill may handle around five per cent moisture, but higher moisture levels will require a separate dryer ahead of the mill. Drying can also be performed by feeding directly to the classifier and adding hot gases to the classifier. Figure 1 shows the annual cost for drying raw materials with a hot gas generator. GBS devitrifies at approximately 700˚C, thereby losing its hydraulic properties and thus excessive temperatures should be avoided.4 Pozzolans such as kaolin clay have temperature dependencies as well that will need to be fully understood before processing.

Figure 1. Annual Cost of Operating a Hot Gas Generator for Drying Materials

3. Vertical Roller Mills

VRMs have been gaining popularity in new projects as energy consumption can be up to 40 per cent less than that of ball mills,in addition to allowing materials with a higher moisture content than competing grinding systems. Many advances in VRM technology have been made for clinker and slag grinding as well as for the production of pozzolanic blended cements.

Technologies such as the ROKSH separator from FLSmidth also provide higher drying capacity for wet materials.8 Other separation technology, like the Loesche LDC Series and Gebr Pfeiffer SLS classifiers, can reduce fineness down to 10µm. 3,6

The abrasiveness of GBS and pozzolan requires high wear-resistant liners. For VRMs grinding very abrasive materials, such as slag, hard-facing is an economical alternative to changing wear parts and is suitable for high-chrome castings, optimizing the grinding process and saving refurbishment costs.8

Innovations in material science have also led to a reduction in the loss of weight of wear parts, increasing their lifespan and reducing shipping costs. While welded liners can be used many times, ceramic liners provide double the amount of life.9 Some companies, such as FLSmidth, are pursuing ceramics. The life of ceramic wear segments is shown in Table 2.

Table 2. Example of Wear Life on FLSmidth’s OK Mill

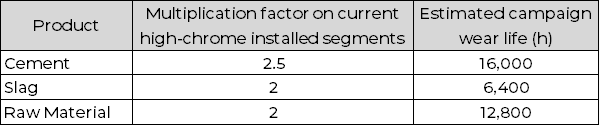
Note. Adapted from FLSmidth OK PRO Plus Ceramic Wear Segments Brochure.

4. Ball Mills

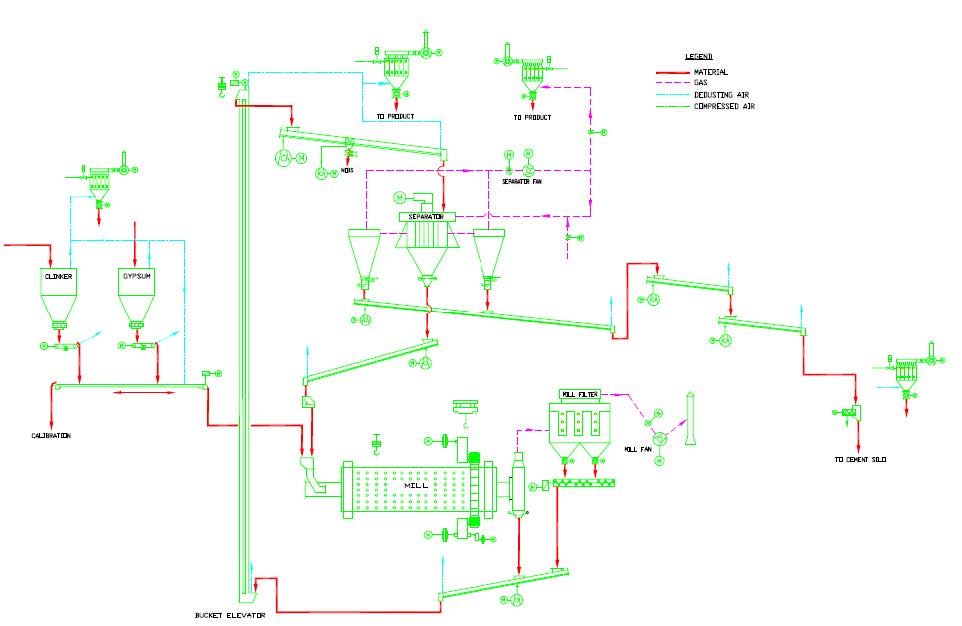
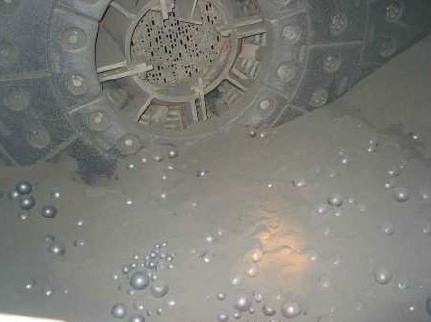
The ball mill (see Figure 2) still constitutes many of the existing grinding systems in place today. Disadvantages are higher energy consumption levels and higher decibel levels when compared with other grinding systems.7 Advantages are ease of operation and lower capital investment cost.2

Figure 2. Typical Ball Mill Arrangement

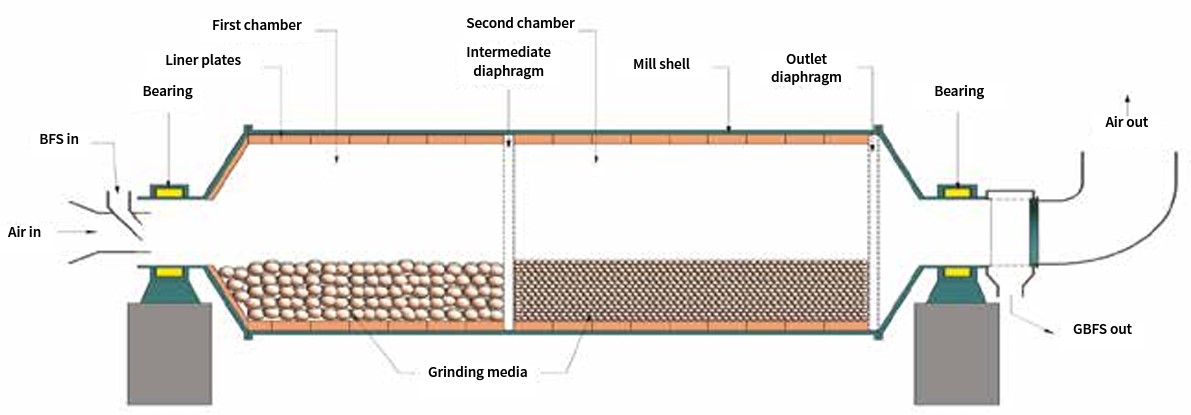
Ball mills have undergone considerable change in the last few decades with trends of increased mill sizes, high efficiency separators and innovative internal designs.7 The efficiency and output are primarily dictated by ball charge for coarse and fine grinding optimization. This has been accomplished mostly in part by internal designs on the maximum angular lift and the accurate trajectory of the ball charge.7

The relationship between production, ball charge loading (in per cent) and kWh should be observed carefully as these factors are pivotal and not mutually exclusive. 7 The ball size is dictated by the hardness of the material and its feed size distribution.

Grinding aids in a ball mill can greatly impact production costs. 7 Three major aspects are the decrease in “pack-set” (agglomeration of mineral coating on the media), increase flowability, and moisture reduction in the feedstock. 7

5. High-Pressure Grinding Rolls

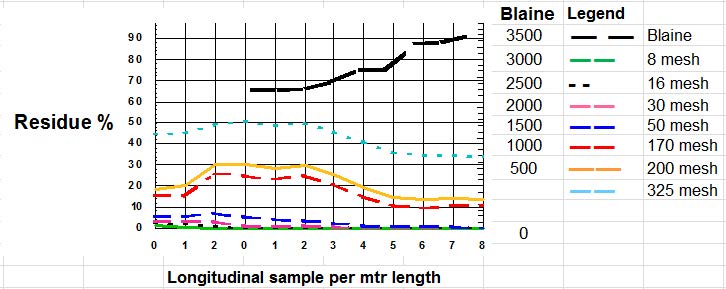
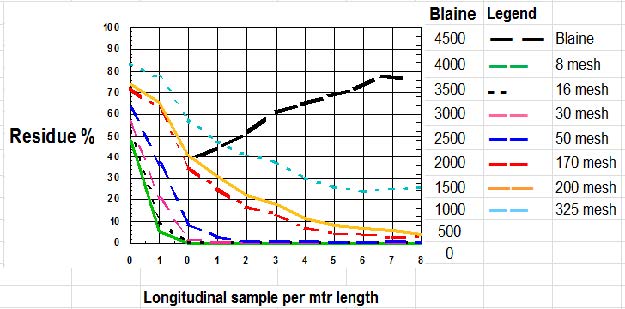
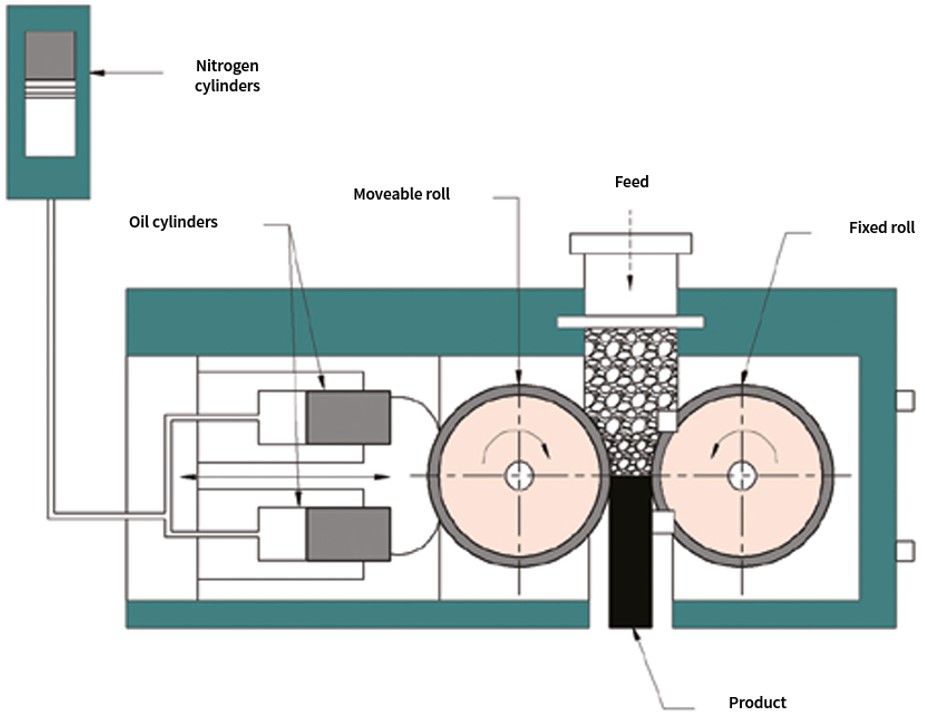
High-pressure grinding rolls (HPGR) technology was first utilized in the grinding of clinker and raw material in the mid-1980s and quickly proved be an economical choice in the comminution process.10 The HPGR compresses the material into a “cake” that includes both fines and coarse material, which later needs to be deagglomerated by a hammer mill, ball mill or a V-separator (see Figure 3). 

A HPGR can reduce energy consumption when working as a pre-grinder ahead of a ball mill, with savings of around 1.8-2.5kWh/t for clinker and 2.53.8kWh/t for GBS.10

Figure 3. High-Pressure Grinding Rolls Compresses Material into Cake

6. Conclusion

To reduce the clinker factor while still developing concrete strength requirements, the use of slag and pozzolans has proven to be very effective in lowering costs and overall positivity to the environment.

References

    • 1 ASTM (2019) ASTM C989-989M – Standard Specification for Slag Cement for Use in Concrete and Mortars. West Conshocken, USA: ASTM, 7p. 
    • 2 LYNCH, A (2015) Comminution Handbook. Southfield, USA: SME, 350p. 
    • 3 LOESCHE (2016) Loesche Mills For Cement and Granulated Blast Furnace Slag E 2016. Düsseldorf, Germany: Loesche, 27p. 
    • 4 DUDA, WH (1984) Cement Databook. Gütersloh, Germany: Bauverlag, 456p. 
    • 5 KERTON, P (2014) Cement Plant Operations Handbook 6th Edition. Dorking, UK: Tradeship Publications Ltd, 290p.
    • 6 GEBR PFEIFFER (2019) Minerals Lime Industry. Kaiserslautern, Germany: Gebr Pfeiffer, 23p.
    • 7 BHATTY, JI (2011) Innovations in Portland Cement Manufacturing. Skokie, USA: Portland Cement Association, 1734p.
    • 8 FLSMIDTH (2017) FLSmidth Cement Mill. Copenhagen, Denmark: FLSmidth, 8p.
    • 9 FLSMIDTH (2020) Webinar OK Mill. November.
    • 10 KOMAR KAWATRA, S (2006) Advances in Comminution. Englewood, USA: Society for Mining, Metallurgy, and Exploration, 568p.

About the Author(s)

Russell Reimer

Mr. Reimer has experience as a Process Engineer includes performing research, design and development of thermoset resin, gel coat and colorant. He is also experienced as a fabricator for a heating equipment manufacturer (flame arrestors and combustion burners), and laboratory technician for a company providing moving and storage of refined products. He holds a Bachelor’s of Science Degree in Chemical Engineering from Oklahoma State University, Stillwater, OK. 

Francisco M. Benavides, P.E.

Mr. Benavides, Principal Consultant at PEC Consulting Group LLC, has many years of experience in project management, design and construction.  He has conducted bankable feasibility studies, economic analysis of mineral transport alternatives, plant valuations for acquisitions and for financing purposes, and due diligence studies.  He holds an MBA from Kellogg School of Management, Northwestern University, Evanston, Illinois; a Bachelor of Science and Professional Degree in Civil Engineering from the Missouri University of Science & Technology, Rolla, Missouri; and has completed Graduate Studies in Engineering Management and Environmental Engineering at Missouri University of Science & Technology.


PEC Consulting Group LLC | PENTA Engineering Corporation | St. Louis, Missouri, USA

How can we help you? Get in touch with our team of experts.

Economic Evaluation of Projects

By Antonio J. Benavides and Francisco M. Benavides

Determining the Discount Rate to Use in Calculating the Present Value of Future Cash Flows

The most common way to assess the economics of a project is the discounted net present value (NPV) of cash flows. Before budgeting a new project, a company must assess the overall level of project risk relative to normal business operations. Higher-risk projects require a larger discount rate than the company’s historical weighted average cost of capital (WACC) and vice-versa for lower risk investments. Project Weighted Average Cost of Capital (WACC) is the hurdle rate or discount rate for evaluating projects having a different risk level than the company’s average risk history. The discount rate is calculated after making an adjustment to WACC with respect to a change in the risk profile of the overall company and the specific project in question. It also works as a benchmark rate for evaluating new projects. If the project IRR is higher than the WACC, the project has a positive economic value.
Calculation of WACC requires analyzing 3 components: 

    1. Cost of debt: The interest rate debt providers would charge the company for providing debt to such an investment.
    2. Cost of equity: The rate of return equity investors would expect on an investment of this nature.
    3. The gearing ratio: The relative proportions of debt and equity used to finance the investment.

The parameters used in the calculations must be estimated or inferred from observable data.  The calculated WACC is thus an estimation based on assumptions and judgments and reference data. The following are the components of WACC formula:

1. Cost of Debt

The cost of debt reflects the financing cost. The cost of debt is the sum of (1) the risk-free rate (Rf) and (2) the margin (premium) that lenders require above the risk-free rate, considering the risk & timeframe of the investment. This is the pre-tax cost of debt.

1.1. Determining the Risk-Free Rate

1.1.1. Risk-free means devoid of the following risks:

      • Interest Rate Risk: changes in market interest rates.
      • Inflation Risk: changes in inflation expectations.
      • Default Risk: default on the repayment of the principal.
      • Liquidity Risk: inability to liquidate the investment timely.
      • Reinvestment Risk: i.e., inability to reinvest investment returns into new investments with similar return characteristics.

1.1.2. The risk-free rate can be determined by the yield of the Treasury bond matching your time horizon for the investment.

1.2. Determining the Debt Premium

The additional return expected by lenders in the project to compensate for the above-described risks:

1.2.1. For projects undertaken by firms with a debt rating the corresponding spread can be directly determined.

1.2.2. If no debt rating is available, a synthetic rating and corresponding spread can be determined from the interest coverage ratio. This is because a firm’s debt premium will tend to increase with higher levels of gearing.

1.2.3. In both cases above, an adjustment should be made to the premium based on the relative risk of the project as compared to the company’s overall risk.

1.2.4. More debt equals more financial risk since the firm requires more cash flows to meet higher interest payments.

Adding the debt premium to the appropriate risk-free rate yields the pre-tax cost of borrowing for the firm to finance the new investment. Once calculated, the cost of debt should be adjusted by the tax shield to reflect how the interest payments on debt reduce the taxable profit of the investment, and hence reduces the tax liability and the effective post-tax cost of serving the debt.

2. Cost of Equity

The cost of equity is the return required by shareholders or individual investors on their investment as a form of compensation for the risk they bear by making such an investment.  The standard framework for calculating the cost of equity is the Capital Asset Pricing Model (CAPM).

The CAPM assumes an equity investor requires the investment to yield:

    • At least the return available on risk-free investments PLUS.
    • A premium for the risk involved in making an equity investment.

Total risk comprises two components:

2.1. Specific (diversifiable or idiosyncratic) risk—the risk specific to a particular firm /investment that can be diversified away by investors and thus is not priced into investor’s required rates of return.

2.2. Systematic (or undiversifiable) risk—how the value of an asset covaries with the economy as a whole and cannot be diversified away by investors, as it tends to have some impact on all firms / investments.

CAPM assumes the required return need reflect only the systematic risk derived by reference to the volatility of the returns on the particular firm / investment relative to those of the market as a whole. The CAPM formula follows:

where:

Cis the cost of equity: a return required by equity investors (expressed as percentage).

RF is the risk free rate.

ß is the beta coefficient: a measure of the extent to which returns on the regulated firm’s shares co-vary with the returns of the market as a whole.

EMRP is the Equity Market Risk Premium: the additional return required for investing in the equity market compared to investing in risk-free assets.

In particular, an investment’s beta can best be determined by looking at the betas of comparable investments and with respect to its specific project risk characteristics.

Finally, if relevant, the country risk premium should also be weighed into the total risk premium:

    • Reflects the inherent risks of investing in particular countries.
    • Reflects differences in the level of financial, political, economic, and institutional stability of different countries.
    • Close to zero for most developed and stable countries.

3. The Gearing Ratio

Please click on the link below for an article regarding determination of the optimal capital structure (most effective mix of debt and equity) for a major capital investment.

The Optimal Capital Structure for Financing an Industrial Project

At PEC Consulting Group we work with each of our customers to adapt a tailored approach to structure the best financing solution for new industrial projects, determined by the specific characteristics and objectives laid forth.

About the Author(s)

Antonio J. Benavides

Mr. Benavides has over 20 years of experience in banking, consulting, project management, digital transformation, and financial risk management. His expertise includes managing all aspects of consulting projects, from design and planning to execution and reporting. His extensive financial services experience includes financial analysis, integration management, operational & sales transformation and organizational development. He has managed projects throughout the US, Europe and Latin America. Mr. Benavides is a Chartered Financial Analyst (CFA), Financial Risk Manager (FRM), and has an MBA from IESE Business School in Barcelona, Spain.

Francisco M. Benavides

Mr. Benavides, Principal Consultant at PEC Consulting Group LLC, has many years of experience in project management, design and construction.  He has conducted bankable feasibility studies, economic analysis of mineral transport alternatives, plant valuations for acquisitions and for financing purposes, and due diligence studies.  He holds an MBA from Kellogg School of Management, Northwestern University, Evanston, Illinois; a Bachelor of Science and Professional Degree in Civil Engineering from the Missouri University of Science & Technology, Rolla, Missouri; and has completed Graduate Studies in Engineering Management and Environmental Engineering at Missouri University of Science & Technology.


PEC Consulting Group LLC | PENTA Engineering Corporation | St. Louis, Missouri, USA

How can we help you? Get in touch with our team of experts.

Pitfalls in Project Development for an Industrial Minerals Processing Plant

By Francisco M. Benavides

Development of a minerals processing facility is complex and requires extensive planning and due diligence. The focus generally goes into the technology to be utilized and the engineering for the project. However, it is important to fully understand the physical and chemical properties of the mineral resource to be utilized and how it relates to the target market. Raw materials can be mined minerals or byproducts from other industries.

The aspects to be considered in project development are as follows:

    1. Geology
    2. Market
    3. Logistics
    4. Competition
    5. Environmental
    6. Public Relations
    7. Technology
    8. Human Resources
    9. Capital Investment
    10. Working Capital
    11. Operating Costs
    12. Economic Analysis

All the above have innate levels of risk which could potentially affect the success of the project. Based on experience and intuition, the project team may gravitate to placing more emphasis on some of the aspects, but all project parameters need to be analyzed in great detail for potential risk.

Figure 1. Project Development Phases

1. Evaluation of Mineral Deposits

The minerals to be processed must be properly qualified and quantified. Failing to do so results in an inadequate process which causes operational problems and costly plant modifications. If the operation is based on a single raw material, as in lime or diatomaceous earth, fully understanding the physical and chemical properties of the deposit is an absolute requirement. In the case of cement, where several raw materials make up the raw mix, there may be some forgiveness in the resource analysis if the corrective minerals are available to adjust the chemistry of the raw feed. In any case, there is no excuse if a major investment takes place without properly understanding the mineral resources to be utilized.

Geological exploration, sampling and material testing must be done by qualified professionals and reviewed by independent consultants. This work can be done in phases so as not to waste money on mineral deposits which do not prove out during initial exploration. This is not a project development aspect where to skimp on budget. There are too many horror stories where the lack of thorough geological exploration, sampling and testing resulted in the wrong process design and selection of equipment.

Standards for geological exploration such as Canadian Standard NI 43-101 or the US SK-1300 should be followed to properly determine the mineral reserves.

2. Market Analysis

It is critical that the market be analyzed in detail; that is, it should comprehend both a macro analysis as well as direct communications with potential customers. Knowing the product quality and specifications that can be generated from the raw materials is the first step in identifying the potential market. Pairing the product with the market can be done by an experienced consultant. The macro market data can be obtained by a specialized market research firm based on specifications from the lead project consultant. The market consultant analyzes the data and develops conclusions as to the market potential for the project. Information on the overall market potential will serve for the first stages of the feasibility study.

Once a general understanding of the market is reached, a more detailed market research is required. This detailed market analysis requires more time and effort including amount of field work, visiting with potential customers and networking within the industry for identification of additional potential customers. This research includes obtaining real pricing being paid for the competitors’ products, including issues with quality and service.

There are many ways to carry out a market study and many possible resources. What matters is that the resulting information is sufficiently reliable to develop the project further. The market study will provide critical data to be used in developing the project economic analysis and will be a key aspect in the evaluation by any entity providing financing for the project.

3. Logistics

Most industrial minerals are low-cost commodities in the sense that the cost of the mineral to the end user will be significantly impacted by freight, warehousing, and other distribution costs. This applies to any transportation cost from mine to processing plant and from the plant to the consumer. In general terms, an industrial mineral only has value where the deposit is close to infrastructure; that is, road, rail, water, power transmission lines, fuel supply and other services. 

The most economical transport is by water in ships or barges, followed by rail and truck. In the project analysis, it is therefore important to consider the cost of logistics as in many cases it may render the project uneconomical. The focus needs to be the all-encompassing delivered cost to the customer and how this compares with the competition, assuming comparable quality and service.

4. Competition

Analyzing the competition is a critical aspect of the feasibility of the project in which both existing and potential competitors are analyzed. Questions to be considered are:

    • Who is the competition for the product we are proposing to place in the market?
    • What quality are they delivering?
    • What are their operating costs?
    • What strengths and weaknesses do they have in relation to our proposed project?

Much of this information could be gathered during the market study. There are many ways to gather information on the competition. This can be done by talking to potential customers, researching posted product specifications and permit filings. This last item can be of significance if a competitor has filed for permits to increase capacity or modify existing production.

A SWOT analysis of the project’s potentials versus those of the competitors will help understand the opportunities for the project.

5. Environmental

Permits may have more of an impact on the project schedule than any other factor. In most cases, there is a significant amount of work that needs to be done in preparation for the filing of the permits. An environmental consultant with experience in the industry and the project general location should be retained as part of the project team to determine the requirements of the responsible governmental agencies. If environmental data is not available for the general area of the project, data will need to be gathered as a reference base for the permit applications. 

Basic engineering needs to be developed by the project consultant to provide the estimated emissions which will be generated by the mining and processing plant operations. The time necessary to prepare for filing permits, the filing itself, and follow up work leading to the eventual issuance of the draft permit, public reviews, to eventually obtain the final construction and operation permits is significant, and often underestimated by project developers.

6. Public Relations

The lack of consideration of this subject is one of the major causes for stopping or delaying the development of a project. Financial wherewithal and political connections may not help because an unhappy neighbor can cause project delays due to a sense of lack of consideration and respect. The project developer must consider all stakeholders as important and give all potential entities impacted by the project the time to ask questions and voice opinions. Many times, educating people on the project details may prevent problems in the permitting process. One customer leased a shop in a nearby town and laid out displays explaining in great detail information on the project. Lack of information causes suspicion and the creation of negative rumors. It is recommended that a public relations specialist be retained to assist in the process of creating a positive attitude by the neighbors for the project.

7. Technology

Determining the technology to be utilized for the project will help the development of all other aspects of the feasibility study. The technology firms or original equipment manufacturers (OEMs) will help with testing of raw materials and fuels, provide equipment sizing and verifying the projected emissions from the process originally calculated by the consultant. The OEMs will also provide budgets which will be used for capital and operating cost estimates.

During the feasibility study, the process specifications should be developed by the consultant, a bid package developed and invitations to bid issued. By the time the feasibility study is completed, the OEMs have been selected for the main process equipment.

8. Human Resources

People make all the difference. In evaluating projects, it is essential to consider the human resources that will be required to execute the project and operate the facility, taking into account all aspects of project development and execution, and operating staff. Mineral processing plants are located usually close to the raw materials to be processed in remote locations where staffing may be a problem. For construction, a remote location will signify a higher capital investment. 

For operations, finding talent willing to relocate to locations where quality housing and services are not readily available is a challenge and may need to be counteracted by higher salaries and possibly investing in the local community to upgrade services. The feasibility study for a project needs to take these issues into consideration in estimating the economics of the project.

9. Capital investments

Mining and mineral processing projects require significant capital outlays. The equipment is expensive and requires heavy industrial construction to withstand the vagaries of the heavy-duty round-the-clock operations. The design criteria must be set and sufficient engineering done to allow an experienced estimator to prepare a reliable capital cost estimate. Materials to be processed need to be tested both by independent laboratories and selected OEMs’ laboratories and pricing obtained from major equipment suppliers. Depending on the level of engineering and procurement activities, contingencies need to be applied to portions of the project according to team based risk analysis. Most times, errors in CapEx work occur not only by miscalculating costs of listed components, but also from missing key components of the project. Why do so many projects go over budget? There are many reasons, but a few potential ones:

    • Project schedule. Time costs money, any delay to the project will add significant costs. Delays can be caused by acts-of-god which cannot be avoided. However, most delays occur due to logistics. Late deliveries to site of key materials and equipment, design errors, lack of expediency in the procurement effort, contractual issues and in general poor planning are major reasons.
    • Incomplete engineering, that is, starting the project before proper engineering has been done to ensure timely deliveries and construction execution. If the project needs to be fast-tracked, engineering is not the place to pinch on budget. Investing in engineering is the only way to have a successful fast-tracked project because engineering will need to be developed as the project moves along and more hours will be required than in a phased project development mode.
    • Unrealistic budget. In order to have a project approved, the CapEx of the project is lowballed when presented to management to receive approval. This is quite common, and it is based on wishful thinking by lowering contingencies and developing an unrealistic schedule.

10. Working Capital

This is part of project development costs that are usually underestimated. Before a facility achieves steady operation in manufacture and sales, sufficient cash to cover operating costs will be required. Working capital must be accounted to cover start up and operational costs encompassing supplies, labor, fuel, electrical power, maintenance, etc. The financing of the project also must be taken into account. The working capital must be such that in the economic analysis it balances negative cash flow for the duration anticipated until sales balances against expenses.

11. Operating Costs

A detailed list of all operating costs is required to ensure all costs are accounted. For this purpose, a consultant with operating experience in the industry is of high value. Alternatively, the owner of the facility may have similar operations which could be audited to account for all operating costs. It is important that both direct and indirect costs be considered. A significant cost, often not taken into account, despite its significance relates to logistics, incoming and outgoing. On a per ton basis, logistics can have a significant impact on the project economics.

12. Economic Analysis

Analyzing the economic viability of a project requires many inputs other that the capital investment and operating costs. Unlike metals, industrial minerals may require a ramp up in sales over a period. Fixed costs are not affected by sales volumes and cash flow depends heavily on sales. It is important that the consultant deduce from the market study the period to ramp up to full production. Other important factors affecting the present value of the project are the cost of capital, taxes, allowed depreciations, depletion when allowed, and other costs which may be charged against the project such as royalties, corporate charges, etc.

Conclusions

There are of course many unknowns in the analysis of a project, some which may be outside the control of the project developer but making sure that the twelve aspects described above are considered carefully will provide the developer and the financing organizations investing on the project a sense of confidence in undertaking the project. As the project develops through the various levels of feasibility analysis, a risk assessment of each of the twelve project aspects should be carried out by the project team and appropriate external consultants. Several methods are available to define the probability of risk on every project aspect and the overall effect on the project from an occurrence. Nothing guarantees total project success; however, not following a process increases the probability of unsatisfactory results.

About the Author(s)

Francisco M. Benavides, P.E.

Mr. Benavides, Principal Consultant at PEC Consulting Group LLC, has many years of experience in project management, design and construction.  He has conducted bankable feasibility studies, economic analysis of mineral transport alternatives, plant valuations for acquisitions and for financing purposes, and due diligence studies.  He holds an MBA from Kellogg School of Management, Northwestern University, Evanston, Illinois; a Bachelor of Science and Professional Degree in Civil Engineering from the Missouri University of Science & Technology, Rolla, Missouri; and has completed Graduate Studies in Engineering Management and Environmental Engineering at Missouri University of Science & Technology.


PEC Consulting Group LLC | PENTA Engineering Corporation | St. Louis, Missouri, USA

How can we help you? Get in touch with our team of experts.

Capturing Value in the U.S. Cement Industry with a Grinding Plant Utilizing Imported Clinker

By Antonio J. Benavides

1. U.S. Cement Market Overview

Cement consumption which is heavily linked to demand from the construction industry has increased worldwide since the 2008 recession. Consumption of cement in the United States has grown to roughly 102 million metric tons in 2019, with cement prices reaching $123.5 per metric ton in the same year (Statista, 2020). This demand was met by cement manufacturing on US soil of approx. 88 million metric tons (86%) and imports of approx. 14 million metric tons (14%).

Figure 1. Annual U.S. Cement Consumption (Expressed in Thousands of Metric Tons)

Note. Adapted from Statista (2020).

Cement production has not reached peak levels since the mid-2000s, which could indicate that some cement plants are still idle or there is underutilized capacity at other plants. Disruptions from plant upgrades, closures, as well as inexpensive imports have also led to lower levels of domestic production. In 2019, U.S. Portland cement production was 86 million tons and masonry cement production 2.4 million tons. Cement was produced at 96 plants in 34 States, and at 2 plants in Puerto Rico.

In 2019, sales of cement was valued at $12.5 billion, most of which was used to make concrete, with approximately 70%-75% of sales to ready-mix concrete producers, 10% to concrete product manufactures, 8% to 10% to contractors, and 5% to 12% to other customer types. Texas, California, Missouri, Florida, Alabama, Michigan, and Pennsylvania were, in descending order of production, the seven-leading cement-producing States and accounted for nearly 60% of U.S. production.

Table 1. Key Statistics in U.S. Cement Industry 2015 – 2019

Note. e Estimated. 1Portland plus masonry cement unless otherwise noted; excludes Puerto Rico unless otherwise noted. 2 Includes cement made from imported clinker. 3Defined as production of cement (including from imported clinker) + imports (excluding clinker) – exports + adjustments for stock changes. 4Defined as imports (cement and clinker) – exports. Adapted from the U.S. Geological Survey, Mineral Commodity Summaries (2020).

At present, cement manufacture is one of the most polluting worldwide industrial sectors.  Improving the sustainability of the cement industry is an important challenge and is mainly focused on lessening CO2 emissions in the USA. To reduce CO2 emissions, cement manufacturers are increasingly developing alternatives to traditional clinker development: These include 1) clinker replacement by ground granulated blast–furnace slag and fly ash, and 2) the importation of clinker from foreign countries, (José Marcos Ortega, et. al., October 2017).

2. Cement and Clinker Imports to the United States

In 2019, 16.3 million metric tons of cement and clinker were imported into the United States: 13.5 million mts of grey cement, 1.42 million mts of white cement, and 1.38 million mts of clinker. The seaborn part of these imports was 12.0 million metric tons (75%). Compared to the seaborne imports in 2010 of 2.85 million tons, this represents 321% growth. 

The overall supply from Asia in 2019 was 2.37 million tons, mainly to the West Coast. The large growth of imports on the US Gulf and East coast has been met from the Europe / Mediterranean region (7.2 million tons, of which 3.9 million tons are from Turkey) and to a lesser degree by Canada and Mexico. 

With respect to the clinker imports, 574 thousand tons comes from Canada (across the great lakes), with the remaining 806 thousand tons being imported from Europe. Of note, the clinker imports from Canada across the great lakes go to stand alone grinding plants of the same ownership of the clinker exporter whereas the clinker imports from Europe (with the exception of a small volume of specialty clinker for aluminate cement) are used by US integrated cement plants that are using their surplus grinding capacity to increase their cement production.

Figure 2. U.S. cement and clinker imports 2019

Note. Adapted from Cement Distribution Consultants (2020). 

3. The Port Facility as an Economically Efficient Solution for the Cement industry

The long-term export availability of low-priced cement and (especially) clinker, in combination with low shipping prices makes it far more economical to import than to build integrated cement plants in coastal areas. Indeed, it is expected that the new coastal cement production facilities will be grinding plants, with blending capability (Ligthart, Nov.2017). 

With US cement plants nearing full capacity, all US cement producers will need import capability to keep market share. Several lack this capability and so will have an interest in new terminal facilities.

Table 2. North American Cement Producers Without Seaborne Import Capability

Note. Adapted from Cement Distribution Consultants (2017).

For those US Cement Producers with seaborne import capability, most of the terminals have ship unloaders that would be able to unload larger vessels, but the average storage capacity is far too low and needs to be expanded or new larger facilities need to be built.

Table 3. Required Storage Capacity by Ship Type and Annual Throughput

Note. Based on 15 days of buffer capacity and a ship unloading rate of 8,000 tpd. Adapted from Cement Distribution Consultants (2017).

The cost efficiency of shipping by Supramax (or larger ship) versus that of a smaller-sized ship is significant.  Current shipping cost from the Mediterranean to US East Coast is about US$ 15-16 per metric ton for Supramax vessels, US$ 18-19 for Handymax vessels and US$ 27-28 for Handysize vessels of around 25.000 Dwt. These shipping costs from a historical viewpoint are very low. Over the lifespan of the terminal´s operation they can be expected to fluctuate with the current cost level as the lower value.

4. Clinker or Cement

Because shipping costs vary over time, it makes more sense not to look at absolute shipping costs and their possible variations but at the relative shipping cost differences between importing cement and importing clinker. When the overall cost of importing clinker and grinding is lower than the cost of importing cement, the grinding plants should be profitable for every perceivable shipping cost. The cost difference between the landed cost of cement and the landed cost of clinker consists of three elements.

    • The FOB price difference of cement and clinker. Currently this is about US$ 5-6 per metric ton
    • The shipping cost difference between cement and clinker varies mostly due to the use of different ship sizes. Current cement imports into US east coast terminals are frequently with Handysize vessels that have an average 35,000-ton shipment size. By utilizing vessels with a cargo capacity of 50.000 tons or larger for clinker imports a current cost difference of US$ 6-8 per metric ton can be realized.
    • Terminal costs for cement are significantly higher than for clinker. A difference of US$ 5-7 is currently achievable.

Currently therefore the landed cost of clinker could be about US$ 16-21 per metric ton lower than for cement (US$ 17.45 – US$ 22.90 per short ton). The grinding costs of clinker are smaller than this cost difference.  Furthermore, if clinker is imported then several types of cement can be produced from that clinker, allowing greater flexibility to meet the specific and possibly changing local market demands.

Finally, with a grinding plant, additional efficiencies can be obtained by combining the imported clinker with other cheaply sourced materials (e.g., limestone, coal ash, slag, etc.) to make blended / specialty cements. The US is quite particular in its use of Type I/II low alkaline cement. This is a cement with a 95% clinker content and only 5% limestone and gypsum. It is a high-quality cement, but it has a very high CO2 output. The global average is a clinker content of about 83%, and there is a big push to reduce this further.

Globally, the clinker trade is growing much faster than the cement trade. A very large number of new coastal stand-alone grinding plants have been built over the last decade and this trend is continuing. By comparison, relatively few new cement terminals have been built during this timeframe. That the US has somewhat lagged in this respect can largely be attributed to the very high clinker content of its cement. In Africa by contrast, imported clinker comprises only 70% of the cement, with the remaining 30% applying local materials. This is admittedly a lower quality of cement, but it moves the economic advantage of importing clinker and grinding it decisively over importing cement.

In Europe stand-alone grinding plants are often combined with blending capability with cementitious materials resulting in high quality blended cements with a low clinker content. A transition by the US towards cements with a lower clinker content will make importing clinker and grinding it even more economical than the situation at present day.

5. Cement Grinding Plant Project Considerations

Several factors should be analyzed in depth when considering the development of a Greenfield cement grinding plant:

    • The market: The regional / local market should be evaluated to understand current supply / demand dynamics (including the type of cement in demand), prices, potential medium-term large infrastructure projects.
    • Marine logistics: An analysis of marine logistics should include the costs to procure clinker and gypsum, the relative cost of these materials versus that of imported and domestically produced cement, shipping and port expenses, port discharge and storage facility costs / requirements.
    • Land logistics: An analysis of the different land transportation options to and from the grinding plant facility, including both highway and rail freight. Also, logistic costs need to be analyzed from the clients’ perspective (distance and convenience of pickup, etc.).
    • Location: Possible locations should be evaluated for the grinding plant considering both the market and logistics studies. In is necessary to ensure adequate and efficient access to the market as well as to keep the logistics expenses at a minimum. In some cases, it may be optimal to place the grinding plant adjacent to the port (reducing land logistics expenses), while in other cases it may make more sense for it to be located at some inland location closer to the market.
    • Cost of real estate leases: Need to identify the probable costs of lease and confirm the possibility to obtain options on the land.  Conceptual design and preliminary engineering: 
      • At the port: Define the facilities and storage location, the conveying or transport system from ship unloading hopper to storage warehouse, flow diagram and equipment list, preliminary drawings, and obtain budgetary pricing from potential equipment suppliers and construction contractors.
      • At the grinding plant (may or may not be at the same location as port facility): Define all the same as in the point above, plus the costs associated with rail transport.
    • CapEx, OpEx and economic analysis: Determine the capital expenditures to build the facilities as well as the expenditures to run the operations. As a final step the economics of the projects must be analyzed in depth to confirm the payback timeframe, IRR and NPV of the project. It is highly recommended to perform sensitivity analysis to understand to what degree the different CapEx, OpEx and financing variables impact the cash flow and overall profitability. 
    • Determine financing options: Depending on the need of external financing to fund the project, a bankable feasibility report should be prepared, putting all the analysis above in a detailed report preceded by an executive summary

References

    • Ligthart, A., Cement Distribution Consultants, “North American cement and clinker imports – An in-depth analysis”, 2017.
    • Ligthart, A., Cement Distribution Consultants, “US cement imports and shipping. A pre pandemic overview and a post pandemic outlook.”
    • “The consumption of Cement in the U.S.”, Statista, 2019.
    • Mineral Commodity Summaries, U.S. Geological Survey, January 2020.
    • Selim, T., Salem, A., Global Cement Industry: Competitive and Institutional Dimensions, June 2010.
    • “How cement companies create value: The five elements of a successful commercial strategy”, McKinsey & Company, November 2016.

About the Author(s)

Antonio J. Benavides

Mr. Benavides has over 20 years of experience in banking, consulting, project management, digital transformation, and financial risk management. His expertise includes managing all aspects of consulting projects, from design and planning to execution and reporting. His extensive financial services experience includes financial analysis, integration management, operational & sales transformation and organizational development. He has managed projects throughout the US, Europe and Latin America. Mr. Benavides is a Chartered Financial Analyst (CFA), Financial Risk Manager (FRM), and has an MBA from IESE Business School in Barcelona, Spain.


PEC Consulting Group LLC | PENTA Engineering Corporation | St. Louis, Missouri, USA

How can we help you? Get in touch with our team of experts.

The Optimal Capital Structure for Financing an Industrial Project

By Antonio J. Benavides

When determining the best course of action to finance a new industrial project, two key factors should be analyzed in depth with respect to the unique characteristics and objectives of the investment:

    • The optimal mix of available sources of debt and equity finance.
    • The investment vehicle: Whether to structure the investment within the owner (project sponsor) firm’s balance sheet, or rather to set up a special purpose vehicle (SPV) involving a non-recourse or limited recourse financial structure.

1. Determining the Optimal Mix of Available Sources of Debt and Equity Finance

Assumptions about the costs of equity and debt, overall and for individual projects, profoundly affect both the type and the value of the investment made by the sponsoring firm. Expectations about returns determine in which projects managers will invest and also its effects on the overall company’s financial performance.

The optimal capital structure of a firm is the best mix of debt and equity financing that maximizes a company’s market value while minimizing its cost of capital. In theory, debt financing offers the lowest cost of capital due to its tax deductibility. However, too much debt increases the financial risk to shareholders and the return on equity that they require. Thus, companies have to find the optimal point at which the marginal benefit of debt equals the marginal cost.

The optimal financing mix will minimize the weighted average cost of capital (WACC) and match the assets being financed, taking into consideration the specific risks of the target investment, thereby optimizing the net present value (NPV) of the investment.

Refer to Figure 1 where Kd is the cost of debt and Ke is the cost of equity.

Figure 1. Capital Structure

In order to determine the optimal financing mix, it is necessary to determine the default spread attributable to the project. For projects undertaken by firms with a debt rating the corresponding spread can be directly determined. If no debt rating is available, a synthetic rating and corresponding spread can be determined from the interest coverage ratio. Adding that number to a risk-free rate should yield the pre-tax cost of borrowing for the firm to finance a new investment. 

Table 1 illustrates synthetic ratings and corresponding spreads for different values of the interest coverage ratio (developed market firms with market cap > $5 billion).

Table 1. For Developed Market Firms With market cap > $5 billion

Note. Adapted from Damodaran (2020).

The operating income that should be used to identify the interest coverage ratio and thereby determine the default spread and optimal debt ratio is a “normalized” operating income (the operating income is the income that this firm would make in a normal year). Specifically:

    • For a cyclical firm, this may mean using the average operating income over an economic cycle rather than the latest year’s income
    • For a firm which has had an exceptionally bad or good year (due to some firm-specific event), this may mean using industry average returns on capital
    • One-time charges or profits should not be considered

Additional firm and sector specific factors may also influence the optimal debt ratio: 

    • Higher tax rates / pre-tax returns imply a higher optimal debt ratio (due to tax benefits).
    • Higher earnings volatility / default spreads imply a lower optimal debt ratio (due to insolvency risks).

2. Off Balance Sheet Project Finance: Non-Recourse or Limited Recourse Financial Structures

Long-term infrastructure / industrial projects can often be financed using a non-recourse or limited recourse financial structure. 

Project financing is a loan structure that relies primarily on the project’s cash flow for repayment to debt and equity holders, with the project’s assets, rights, and interests held as secondary collateral. 

Project finance is especially attractive to the private sector because companies can fund major projects off-balance sheet. Project finance through special purpose vehicles (SPVs) are especially frequent in Build-Operate Transfer (BOT) projects for example. The entity’s sole activity is carrying out the project by subcontracting most aspects through construction and operations contracts. Since there is no revenue stream during the construction phase of new-build projects, debt service only occurs during the operations phase, therefore generating significant risks for the financing parties during the construction phase. 

Since the project remains off-balance sheet, there is limited or no recourse to the project’s sponsors. To preempt deficiency balances, loan-to-value (LTV) ratios are usually limited to 60% in nonrecourse loans, and lenders impose higher credit standards on borrowers to minimize the chance of default. Non-recourse loans, on account of their greater risk, carry higher interest rates than recourse loans

3. Conclusions

In conclusion, determining the optimal mix of available debt and equity sources of finance as well as the optimal vehicle through which to structure the investment are critical decision factors that can significantly improve the economic returns and feasibility of the project, and therefore facilitate capturing the required financing from third parties to make the new undertaking a reality.

At PEC Consulting Group we work with each of our customers to adapt a tailored approach to determine and help structure the best financing solution for new industrial projects, determined by the specific characteristics and objectives laid forth.

About the Author(s)

Antonio J. Benavides

Mr. Benavides has over 20 years of experience in banking, consulting, project management, digital transformation, and financial risk management. His expertise includes managing all aspects of consulting projects, from design and planning to execution and reporting. His extensive financial services experience includes financial analysis, integration management, operational & sales transformation and organizational development. He has managed projects throughout the US, Europe and Latin America. Mr. Benavides is a Chartered Financial Analyst (CFA), Financial Risk Manager (FRM), and has an MBA from IESE Business School in Barcelona, Spain.


PEC Consulting Group LLC | PENTA Engineering Corporation | St. Louis, Missouri, USA

How can we help you? Get in touch with our team of experts.

Systems to Control Nitrogen Oxides (NOx) in Coal Fired Power Plants

By Prasanna Seshadri

Abstract

Commonly referred to as NOx, Nitrogen oxides are one of the primary pollutants emitted by high  temperature combustion systems such as pulverized coal (PC) fired boilers. Due to its role in both  acid rain and ozone formation, NOx is a regulated pollutant under the EPA’s Clean Air Act. The options to reduce NOx emissions include source reduction and post combustion treatment of the flue gas. To control NOx at source, fuel and air distribution, otherwise referred to as staging, are modified  to reduce flame temperatures. This is typically achieved by using low NOx burners.

Post combustion measures for NOx control include both catalytic (SCR) and non-catalytic (SNCR)  where NOx in the flue gas is reduced to molecular Nitrogen by reaction with Ammonia. However,  it is quite common for utilities and other industrial combustion systems to employ both source  reduction and flue gas treatment to meet required regulations. This paper will particularly focus  on the two tail end options, SCR and SNCR, for flue gas NOx control.  

1. Introduction

Nitrogen oxides (NOx) denote the combined emissions of nitric oxide (NO), nitrogen dioxide (NO2)  and other nitrogenous species in combustion derived flue gas. While NOx comprises all  oxygenated nitrogen species, NO is the most dominant species in combustion gases accounting  for anywhere between 95-99% of the total NOx in the gas stream. Together with SOx and  Particulate Matter (PM), NOx is strictly regulated.  NOx contributes to the formation of smog and acid rain, as well as increasing the amount of ozone (O3) in the earth’s troposphere. When NOx and volatile organic compounds (VOCs) react in the  presence of sunlight, they form photochemical smog, which is a significant form of air pollution.   The high concentrations of ozone in the atmosphere typically arise from high NOx emissions together with other reactive hydrocarbons, termed as VOCs. At lower levels, ozone is created by  a chemical reaction between nitrogen oxides (NOx) and VOCs in the presence of heat and  sunlight. Production of O3 follows the chain reaction mechanism as follows7

NOx + VOCs + Sunlight → O3 + other products (1) 

NO2 + hν → NO + O(3P), λ<400 nm (2)

O(3P) + O2 → O3 (3)

Peroxy-radicals (HOCO) in the atmosphere, produced as a result of carbon monoxide (CO)  oxidation with the hydroxyl radical OH, go on to react with NO to produce NO2, which is then  photolysed by UV-A radiation to give a ground-state atomic oxygen. This further reacts with  molecular oxygen to form ozone7.   While NOx emission limits vary globally, the U.S has one of the strictest limits in the world,  especially for existing coal power plants. For new installations, the limits are even more stringent  requiring the use of Best Available Control Technology (BACT) in both attainment and non attainment areas. Selective Catalytic Reduction, referred to as SCRs, is the current BACT for NOx control in power plants and also for other industrial applications. NOx is also regulated in  combustion engine vehicles, especially vehicles using diesel engines. 

2. Nitrogen Oxides (NOx) from Fuel Combustion

Typically, NOx formation happens during fuel combustion through two major pathways. In the  first case, Nitrogen present in combustion air reacts with oxygen forming Nitrogen Oxide species.  This is referred to as Thermal NOx and is a result of high combustion temperatures. The other  major source of NOx is fuel NOx which is the result of fuel Nitrogen reacting with the oxygen in  combustion air. Unlike thermal NOx, fuel NOx formation can happen at much lower gas  temperatures. Fuel NOx is a significant contributor especially in coal power plants and can  account for over 50% of the overall amounts of NOx generation. The control of NOx in combustion  derived flue gas usually involves a two-phased approach – during fuel combustion and post  treatment of flue gas. The primary focus of combustion control is to minimize thermal NOx formation and the latter option is to reduce the overall amount of already formed NOx.  

3. Control Techniques

3.1. At Source Reduction

With the development of advanced burner technologies, NOx control begins with fuel  combustion. Low NOx burners are designed to reduce the overall combustion temperature, thereby reducing the total amount of thermal NOx.   Low NOx burners control fuel and air mixing to create larger and more branched flames. They  accelerate fuel ignition and intensify combustion by achieving fuel rich conditions in the burner  zone1. By improving ignitibility in rich fuel flame areas and producing moderate combustion in  moderate fuel flame areas, the production of NOx emissions is reduced2.

Figure 1. Low NOtype NR burner by Mitsubishi Hitachi Power Systems

Note. Adapted from https://www.mhps.com/products/boilers/technology/low-nox-burner/index.html

Combustion reduction and burnout are achieved in three stages within a conventional low NOx burner. In the first stage, combustion occurs in a fuel rich, oxygen deficient zone where NOx formation takes place. In the second stage a reducing atmosphere follows where hydrocarbons  react with the already formed NOx and reduce them to molecular Nitrogen. In the third and final  stage of combustion an oxygen rich environment finalizes combustion of the fuel. Control of  secondary air is important to ascertain full combustion, but not enough oxygen to regenerate  NOx2. 

However, source control by itself is not enough to meet NOx emission standards. Downstream  technologies are also required to further reduce NOx. The two most common downstream  measures to control NOx are Selective Catalytic Reduction (SCR) and Selective Non-Catalytic  Reduction (SNCR). Both technologies convert NOx in the flue gas to inert molecular Nitrogen by  reaction with ammonia. The different reactions for NOx reduction are shown below and is  applicable for both SCRs and SNCRs. 

4NO + 4NH3 + O2 → 4N2 + 6H2O (4)

2NO2 + 4NH3 + O2 → 3N2 + 6H2O (5)

NO + NO2 + 2NH3 → 2N2 + 3H2O (6)

There are process, efficiency and cost differences between the two technologies and due  diligence is required to make a proper selection. The selection of NOx control systems needs to  be done in coordination with the overseeing environmental agency. 

3.2. Selective Catalytic Reduction (SCR)

SCRs are state of the art systems used to eliminate or reduce NOx emissions from the flue gas  stream. In this process, ammonia (NH3) is injected into the flue gas stream to create a chemical  reaction between NOx and NH3 forming inert Nitrogen molecules and water vapor as products.  These chemical reactions are shown in equations 4-6. For the chemical reactions to occur, the  gas needs to be between the optimum temperatures of 300°C and 400°C; therefore, the system  is usually placed before the air preheater, at the exit of the economizer.

This technology uses a  catalyst which facilitates the breakdown of NOx and increases the overall conversion efficiency.  Most catalysts used in coal power plants consist of vanadium making up the active catalyst, and  the substrate (or catalyst support) is usually made of titanium3. Active catalyst is finely dispersed  across the support media. However, the final composition can consist of many active metals and  support materials to meet specific requirements in each SCR installation. Typically, over 90% reduction in NOx can be achieved with the installation of a SCR6. SCRs are also a widely used  technology in the off-gas treatment of large gas combustion turbines.

Figure 2. Schematic of a SCR process

Note. Adapted from https://www3.epa.gov/ttn/ecas/docs/SCRCostManualchapter7thEdition_2016.pdf

SCRs are designed to handle dust loads and do not require dust capture equipment upstream of  the process. The system is relatively easy to maintain and capable of stable operation. While the  system offers high NOx control, it is capital cost intensive and requires considerable plant outage  time for retrofit applications.

Figure 3. Selective Catalytic Reduction (SCR) System

Note. Adapted from https://www.mhps.com/products/aqcs/lineup/flue-gas-denitration/

SCR capital costs vary by the type of unit controlled, the fuel type, the inlet NOx level, the outlet  NOx design level, and reactor arrangement. Data collected on new installations between 2012- 14 indicated SCR costs ranged from $270/kW to $570/kW5. Typical operation and maintenance  costs are approximately 0.1 cents per kilowatt-hour (kWh)5. Operating costs for SCR consist  mostly of replacement catalyst and ammonia reagent, and while historically the catalyst  replacement has been the higher cost, the reagent cost has become the most substantial portion  of operating costs for most SCR. Since the gas pressure drops across the SCR system, the plant  may also require ID fan modifications to compensate for the increased pressure loss.  

3.3. Selective Non-Catalytic Reduction (SNCR)

While SCR is considered as the BACT, in certain applications, SNCR technology can be deployed  at a relatively low capital cost. However, SNCR does not employ a catalyst and NOx reduction is typically a modest 30-50%4 for most systems. This technology utilizes atomizing nozzles to inject  ammonia directly into the hot gas to chemically reduce NOx to Nitrogen and water vapor.  Unlike the SCR, NH3 injection is at a much higher temperature window between 850-1,050°C4. The goal  is to maximize NOx control performance while optimizing chemical utilization with low reagent  consumption. 

Figure 4. Schematic of SNCR Process

Note. Adapted from https://www3.epa.gov/ttnecas1/models/SNCRCostManualchapter_Draftforpubliccomment-6-5- 2015.pdf

Additionally, urea can also be used as a reagent for SNCR applications. Urea (NH2CONH2) is easier  to handle and store than NH3. Hence, urea-based systems are more common than ammonia based deployments, but operating data reveals higher NOx reductions occur with ammonia  reagent. This is mainly due to improper and incomplete gas mixing with urea injection compared  to anhydrous ammonia. Urea dissociates into ammonia first and then reacts with NOx as shown  in chemical reactions 4-6. The dissociation of urea to ammonia is as follows: 

NH2CONH2 + H2O -> 2NH3 + CO2 (7)

Figure 5. Urea Based SNCR Process Schematic

Note. Adapted from https://www3.epa.gov/ttnecas1/models/SNCRCostManualchapter_Draftforpubliccomment-6-5- 2015.pdf

The effect of temperature is critical for SNCR applications. Not only does temperature affect  conversion efficiencies, but it can also have a debilitating effect if ammonia or urea is injected  outside the recommended range. At lower temperatures NO and the ammonia do not react.  Ammonia that has not reacted is called ammonia slip and can react with other combustion  species, such as sulfur trioxide (SO3), to form ammonium salts. These salts can later form hard deposits on downstream equipment thereby reducing operating efficiencies. At higher  temperatures ammonia decomposes to form more NOx.

SNCR is applied in a wide range of industrial processes, including cement and steel production.  While not a BACT option for power plants, it is suited for areas under Reasonable Available  Control Technology (or RACT) protocol. Retrofits are also much easier and require a small area  for installation. Available data for Best Available Retrofit Technology (BART) analyses for 11  cement kilns indicates estimated NOx reductions for SNCR systems between 35 percent and 58 percent with a median reduction of 40 percent6.

The mechanical equipment associated with an SNCR system is simple compared to SCR and hence  capital costs for SNCR installations are generally low. Based on available data, the installed capital  cost of SNCR applications ranged anywhere between $5–20/kWe (kilowatt) for power generation  units6. The absence of an expensive catalyst reduces CapEx requirements for both new systems  as well as retrofits. Most of the cost of using SNCR is an operating expense. Reagent costs  currently account for a large portion of the annual operating expenses associated with this  technology. The annual cost of reagent purchase in $/yr is estimated using the reagent volumetric flow rate, the total operating time, and the unit cost of reagent. One of the bigger challenges  with SNCRs is the stack emission of ammonia slip and this concentration is typically higher than  SCRs due to larger injection rates. The temperature window at which SNCR typically operates  plays a role in NH3 slip levels. Distribution of the reagent can be challenging especially in larger  coal-fired boilers because of the long injection distance required to cover the relatively large  cross-section of the boiler. Multiple layers are required to adjust to constantly changing boiler  loads and this makes it challenging to fine-tune. Additionally, when urea is injected, large  quantities of water are required, which can result in efficiency losses.

Depending on the type of process, PEC Consulting can help in the selection of the best control  technology to help reduce NOx emissions. We conduct an objective analysis to select the most feasible and efficient option to meet overall process and environmental requirements.

References

    • 1STEAM / Its Generation and Use, The Babcock & Wilcox Company, 42nd Edition 2. International Energy Administration, Clean Coal Centre, Clean Coal Technologies, “Low  NOX Burners”, https://www.iea-coal.org/low-nox-burners/ 
    • 2International Energy Administration, Clean Coal Centre, Clean Coal Technologies,  “Selective Catalytic Reduction (SCR) For NOx Control”, https://www.iea coal.org/selective-catalytic-reduction-scr-for-nox-control/ 
    • 3International Energy Administration, Clean Coal Centre, Clean Coal Technologies,  “Selective Non-Catalytic Reduction (SNCR) For NOx Control”, https://www.iea coal.org/selective-non-catalytic-reduction-sncr-for-nox-control/
    • 4International Energy Administration, Clean Coal Centre, Clean Coal Technologies, “Selective Non-Catalytic Reduction (SNCR) For NOx Control”, https://www.ieacoal.org/selective-non-catalytic-reduction-sncr-for-nox-control/
    • 5Chapter 2, Selective Catalytic Reduction,  
    • 6https://www3.epa.gov/ttn/ecas/docs/SCRCostManualchapter7thEdition_2016.pdf 6. Chapter 1, Selective Noncatalytic Reduction,   https://www3.epa.gov/ttnecas1/models/SNCRCostManualchapter_Draftforpubliccomm ent-6-5-2015.pdf 
    • 7Reeves, Claire E.; Penkett, Stuart A.; Bauguitte, Stephane; Law, Kathy S.; Evans, Mathew  J.; Bandy, Brian J.; Monks, Paul S.; Edwards, Gavin D.; Phillips, Gavin (2002-12-11).  “Potential for photochemical ozone formation in the troposphere over the North  Atlantic as derived from aircraft observations during ACSOE”. Journal of Geophysical  Research: Atmospheres. 107 (D23) 
    • 8https://www.mhps.com/products/aqcs/lineup/flue-gas-denitration/

About the Author(s)

Prasanna Seshadri, PhD

Dr. Prasanna Seshadri is an experienced engineer with strong background in process design, project engineering and management, technology and new product development for a wide range of energy conversion and environmental control processes used in power and other heavy manufacturing industries. He is Subject Matter Expert (SME) for solid fuel combustion, acid gas, and heavy metals emission control for thermal conversion systems and wastewater treatment. He has a BS in Chemical Engineering from the University of Madras, India, MS in Environmental Engineering and PhD in Energy Engineering from the University of North Dakota.

PEC Consulting Group LLC | PENTA Engineering Corporation | St. Louis, Missouri, USA

How can we help you? Get in touch with our team of experts.

Electric Power Generation From Kiln-Off Gases

By Narayana Jayaraman

1. Introduction

Waste Heat Recovery based power generation projects (WHR) in cement and lime plants are designed to capture the heat from the pyro-process off-gases to drive a thermodynamic cycle that operates a turbine and a generator. The thermodynamic cycle can utilize steam (Steam Rankine Cycle) or an organic fluid (Organic Rankine Cycle) as the operating medium.

2. Waste Heat Recovery Available for Power Generation

The most important task in designing the WHR system is to make the correct assessment of waste heat available for power generation. To this end, our consultants obtain the gas quantities and temperatures from the plant operating data and this information is then validated by comparing reported values and calculated values. 

The heat required for other sections of the manufacturing process, such as drying of raw materials and coal, is carefully evaluated. ONLY the residual available heat is considered for power generation.

The moisture level of raw materials may not be constant throughout the year according to the season. The moisture’s monthly cycle and the corresponding heat requirement are evaluated to determine the optimum heat availability for sizing the WHR equipment. Choosing the maximum heat for sizing WHR equipment may render the entire project unviable economically, if for instance, the maximum quantity is available only for one month in a year.

3. Steam Rankine Cycle

The Steam Rankine Cycle (SRC) utilizes water as the thermodynamic fluid. The heat exchanger directly uses water and the heat is used for converting the water into high-pressure steam, which drives the turbine and the generator.

4. Organic Rankine Cycle

The Organic Rankine Cycle (ORC) uses an organic fluid to convert liquid to high pressure vapor which runs the turbine and the generator. However, due to the higher cost of the organic fluid and risk of exposing it directly to the hot gases, there is an intermediate thermal oil loop that collects the heat from the hot gases through a heat exchanger and delivers it to the thermodynamic fluid at the power plant.

5. Brief Comparison between SRC and ORC 

Table 1 gives a broad comparison of the two systems:

Table 1. Comparison Between SRC & ORC systems

Most plants expect a payback period of 5 years, which can happen only with high power tariffs (>0.10 $/kWh) and very favorable configurations (large kiln with high temperature gases) and much lower CapEx (~3-4 M $/MWe power). WHR projects are many times financially feasible if the Government provides a good incentive for waste heat utilization and for reducing the carbon footprint. 

It is to be emphasized that the Owner requires an experienced consulting company having expertise in cement/lime process as well as WHR systems to truly evaluate opportunities and integrate designs with the existing plant operations.

PEC Consulting provides the crucial role of due diligence, choice of appropriate capacity and system, and engineering for integrating with the plant.  

About the Author(s)

Narayana Jayaraman

Mr. Jayaraman has over 48 years of experience in the cement industry with expertise in plant conceptualization, layout, various operating systems, process calculations, production optimization, and Waste Heat Recovery (WHR) based power projects for cement and lime plants. He has led several studies to estimate realistic waste heat for power generation. He has had in-depth exposure to the technical, economic, and commercial aspects of large cement projects, and extensive experience in the upgrade and optimization of existing plants. He earned a BS in Mechanical Engineering from Osmania University, Hyderabad, India, and an MS in Mechanical Engineering from the Indian Institute of Technology, Kharagpur, India.


PEC Consulting Group LLC | PENTA Engineering Corporation | St. Louis, Missouri, USA

How can we help you? Get in touch with our team of experts.

Sandstone Deagglomeration for Frac Sand

By Pompeyo D. Rios

Sand particles derived from sandstone are delivered to the crusher hopper as rocks and boulders. Unlike mine crushing where the purpose is to reduce the size of the rocks to go into mills, the goal in frac sand operations is to liberate sand particles from the rocks while minimizing internal stress fractures in the sand particles.

Crushing plants are usually composed of a primary crusher, secondary crusher, and screening towers. The primary crusher breaks the rocks into smaller sized rocks that are thus conveyed to a screen where the smaller particles are carried away and larger rocks are fed to a secondary crusher to further break down and de-cluster the rocks. From the secondary crusher, material is fed to screens for further separation.

There are basically two forms of mineral crushers; compression and impact. The compression crusher (Jaws and Cone) breaks the material by compressing the rocks between a movable plate and a fixed plate. Impact crushers can be subdivided in horizontal and vertical. The Horizontal Shaft Impactor breaks the mineral by impacting the material with a moving hammer or bar against impact plates. The Vertical Shaft Impactor (VSI) has a rotor that throws rocks against impact plates.

The Jaw Crusher is used as the primary crusher for lime and frac sand plants, as it reduces large size rocks by compression minimizing dust. A fixed plate, mounted in a “V” alignment, is the stationary breaking surface, while the moving jaw applies force on the rock by forcing it against the stationary plate (see Figure 1). The space at the bottom of the “V” aligned jaw plates is the crusher product size gap. The rock remains in the jaws until it is small enough to pass through the gap at the bottom of the jaws. The Jaw Crusher is usually used as the primary crusher for a reduction ratio of 8:1. This type of crusher usually produces few particles below 1” It has low wear per ton in abrasive materials like silica sand; however, it is more expensive than an impact crusher.

Figure 1. Jaw Crusher

The Cone Crusher crushes materials by the compression force between the inner movable cone and the outer fixed cone. The movable cone is supported by a shaft which is set in an eccentric sleeve. The eccentric sleeve moves the movable cone near the fixed cone grinding rocks by compression into smaller pieces (see Figure 2) The fixed cone can be risen or lowered to adjust the size of the discharge gap.

The Cone Crusher is used as a secondary crusher because it can handle smaller feed size than the jaw crusher. The reduction ratio is 8:1. Production drops when producing small particles like frac sand. Its wear cost per ton is less than that of the impact crusher.

Figure 2. Cone Crusher

The Horizontal Shaft Impactor (HSI) crusher consists of hammers that are fixed to the spinning rotor (see Figure 3), which break the rocks. Normally, the Horizontal Shaft Impactor crushers are used for soft to mild materials like gypsum, phosphate, limestone and weathered shales. They are usually used as primary or secondary crushers with as much as 24:1 reduction ratio. HSI does not leave internal stresses in the sand particles as may be caused by other crushers.

The big disadvantage of the HSI is that the wear per ton is very high when used with abrasive material. In the frac sand industry, the wear cost and downtime are normally not satisfactory.

The Vertical Shaft Impactor (VSI) has a high-speed rotor with wearing resistant tips that throw the rocks against stationary breaker plates (anvils) made up of composite metal alloys (see Figure 4). The predominant force is the velocity of the rotor that can be adjusted depending on the feed quantity and to avoid stressing sand particles. VSIs are typically used as secondary crushers because their feed design can handle smaller rocks, usually below 8”.

Figure 3. Horizontal Shaft Impactor

Figure 4. Vertical Shaft Impactor

The recommended crushing arrangement to produce the frac sand from sandstone is to install a Jaw Crusher as the primary crusher, followed by a vibratory screen to scalp the small sized material. The coarse materials from the screen are fed to a Vertical Shaft Impactor used as secondary crusher. The secondary crusher and screen are laid out in a close circuit where the fines are sent away, and the coarse rocks are sent back to the VSI.

About the Author(s)

Pompeyo D. Rios

The extent of Mr. Rios’ experience encompasses the design and successful project management of heavy and light industrial plants, both domestic and foreign, including mineral processing facilities, cement and lime plants. He has been responsible for the preliminary layout and detailed engineering of grinding facilities, cement and lime pyroprocessing systems, coal grinding and firing systems, material handling systems, crushing and screening facilities. He is highly experienced in the preparation of bid documents, contracts, capital and operation cost estimates, evaluation of OEM equipment bids, economic evaluation, and feasibility studies. He was directly involved with the equipment layout and design of waste heat recovery (WHR) and co-generating systems. Mr. Rios is fluent in English and Spanish. He holds a BS in Mechanical Engineering from the Universidad Metropolitana, Caracas, Venezuela, and a Masters in Business Administration, Information Systems and Finance/Accounting from Regis University, Denver, CO. He also holds a Certificate in Economic Evaluation and Investment Decision Methods from Colorado School of Mines, Golden, CO.


PEC Consulting Group LLC | PENTA Engineering Corporation | St. Louis, Missouri, USA

How can we help you? Get in touch with our team of experts.

Silo Roof Failure: Are Your Roofs Failing?

By Petko A. Vlaytchev & Francisco M. Benavides

1. Basic Premises

Maintenance of cement storage silo roofs is challenging because the areas which may need repair are not readily visible and often structural damage is not noticed until a significant failure has occurred, the roof has settled, and the risk of impending total failure has been reached. Often times, when the damage is extensive, operations need to shut down for repairs affecting production and product dispatch. If a bank of silos is involved, the whole cement plant may need to cease operations.

Aging silos often show signs of deterioration, usually visible in the spalling and cracking of the exterior of silo walls. This is due mostly from exposure to the weather. Problems with silo roof slabs are mostly related to critical structural conditions, such as dust buildup, the addition of heavy equipment to the original design, or flaws with the original design.

The roof beam supports should have been designed to accommodate for thermal expansion. This is accomplished by allowing the roof beam base plates to freely slide in the longitudinal direction over an embedded steel plate on the wall beam pocket.

The embedded plates that support the roof beams are usually involved in the failure process. Weather and temperature changes cause the concrete walls to deteriorate faster around the beam pockets than the rest of the silo walls. Such deterioration leads to spalling and loosening of the bond between the emended steel anchors and the concrete walls. When such conditions occur, the roof supporting steel beam will eventually rest on unprotected concrete. The constant thermal movement of the beam, combined with the dead and live loads applied on it, results in a grinding force between the beam’s base plate and the silo wall with the eventual result of breakage of a part of the silo wall immediately under the beam. When this happens, the beam shifts downward until it rests again on a solid portion of the silo wall. The roof slab then deflects at which time the failure is usually noticed by the operators.

In some cases, the silo roof slabs experience downward movements. The initial deformation may go unnoticed for a while due to dust buildup and the general age of the silos. Delay in the proper detection could potentially lead to overloading of the slabs, especially on structures with marginal safety factors, since material and water will attempt to “level off” the sunken portion of the slab. As the deflection increases, the buildup grows and eventually the slab and the beams will reach the limits of their structural capacity. Furthermore, the increased loads result in greater friction force between the beams and the walls and could lead to another breakage in the silo walls.

2. Preventive Actions

When a silo roof starts deflecting, serious structural damage may have already occurred. Roof structural issues need to be detected at an early stage to prevent collapse of the roof or the inability to use the storage silo’s full capacity. An engineering review of current silo roof structural loads versus the original design criteria for live loads is recommended as a first step in the maintenance of cement storage silos.

This should be followed by visual inspections of the roofs exterior and interior surfaces, the supportive members, connections and roof beam bearing plates.

3. Corrective Actions

When failure occurs, the first step of the remedial works is the physical inspection of all silo roof beam pockets. This could be accomplished by opening the external pocket plates, if such are provided, or by inspecting the inside of the pockets with cameras.

If the inspection confirms that the cause of the deflection is the deterioration of pockets, the next step is engineering a fix to restore the pockets to their original condition. Engineering must include a rigging system to suspend the affected beams and provide a safe environment for personnel working on the repairs. The next step is the development of a design to restore the sliding surfaces. In most cases this step involves the placement of securing steel plates against the concrete walls to create a box and filling gaps left by spalled concrete with high-strength non-shrink grout.

The third step includes the reinforcement to the existing steel beams designed to carry the additional loads from material used to level the deflected surface of the roof slab.

About the Author(s)

Petko Vlaytchev

Mr. Vlaytchev is proficient in detailed engineering design for new construction, upgrades, conversions, and evaluations of structures for projects worldwide. He has over 20 years of experience in the design of steel and concrete structures for industrial projects. He has designed a wide range of structures such as pre-heater towers, silos, mill foundations and buildings, ductwork and material handling systems. Mr. Vlaytchev earned a Master’s and Bachelor’s degrees in Structural Engineering from the Higher Institute of Architecture and Civil Engineering in Sofia, Bulgaria.

Francisco M. Benavides, P.E.

Mr. Benavides, Principal Consultant at PEC Consulting Group LLC, has many years of experience in project management, design and construction.  He has conducted bankable feasibility studies, economic analysis of mineral transport alternatives, plant valuations for acquisitions and for financing purposes, and due diligence studies.  He holds an MBA from Kellogg School of Management, Northwestern University, Evanston, Illinois; a Bachelor of Science and Professional Degree in Civil Engineering from the Missouri University of Science & Technology, Rolla, Missouri; and has completed Graduate Studies in Engineering Management and Environmental Engineering at Missouri University of Science & Technology.


PEC Consulting Group LLC | PENTA Engineering Corporation | St. Louis, Missouri, USA

How can we help you? Get in touch with our team of experts.

NFPA 652 Dust Hazard Analysis (DHA) Study

By Mohammed Dimah

The most recent NFPA publication applicable to cement and lime plants, NFPA 652, mandates that every industrial facility handling solid fuels needs to complete a Dust Hazard Analysis (DHA) Study by August 2018, after which deadline plants risk becoming non-compliant.

Most cement and lime plants use coal and other solid fuels for their operation and therefore come under the purview of this mandate.

NFPA 652 “Standard on the Fundamentals of Combustible Dust” was created to include several older standards (NFPA-61, 68, 654) as a single go-to source for a systematic study of fire and explosion hazards and to develop mitigation measures. 

The DHA Study promotes awareness of the following principles:

    • Fuel management controls.
    • Ignition source controls.
    • Restraining the spread of any combustion event.

It applies to equipment handling coal and other combustible dusts, including Dust Collectors, Bucket Elevators, Drag and Screw Conveyors, Pneumatic Conveying Systems, and Storage Bins and Silos. 

DHA consists of 3 main steps to complete the analysis: Material & process identification, material & process hazard analysis, and hazard management plan.

1. Material & Process Identification

    • Determine the characteristics of the dust with tests recommended in NFPA 652 to assess how combustible or explosible the dust is.

    • Identify the process areas where there exists potential combustibility and explosibility

2. Material & Process Hazard Analysis

    • Evaluation of every process area that could promote fire and explosion hazards
    • For each identifies hazard area, the following aspects are analyzed:
      • Is the dust combustible in this segment?
      • Is the dust suspended in air?
      • Is the dust concentration such as to support a deflagration?
      • Is there an ignition source that could ignite the dust cloud present?
      • What hazard management controls are in place?

3. Hazard Management Plan

The Hazard Management Plan outlines the mitigation measures to be implemented for managing the suppression of deflagration and/or isolation of the source of deflagration. A written management system is developed for operating the facility to prevent or mitigate fires, deflagrations, and explosions from combustible particulates.

NFPA 652 outlines the topics to be covered in DHA and recommends a format to present the report.

PEC Consulting can help carry out a DHA Study for new or existing cement & lime plants and help the clients to develop a Hazard Management Plan.

About the Author(s)

This article was contributed by M. Dimah, Process Engineer for PEC Consulting, Mr. Dimah has a BS in Chemical Engineering from the University of Technology, Baghdad, Iraq, and a Master’s in Chemical Engineering from the Polytechnic University of Valencia, Valencia, Spain.


PEC Consulting Group LLC | PENTA Engineering Corporation | St. Louis, Missouri, USA

How can we help you? Get in touch with our team of experts.

How to Increase Frac Sand Product Yield?

By Pompeyo D. Ríos

There is a direct correlation between wasted product – which sometimes could be as high as 50% — and the process system efficiency at a frac sand manufacturing plant. The solution to minimize waste and increase profits lies in the optimization of plant product yield. 

Product yield in relation to the product mined is key to the economics of a plant’s operation. In a frac sand operation, the product yield is the relation between tons of product processed for sale and the actual tons of material mined. This product yield ratio should be in the neighborhood of 75%. 

In order to improve frac sand product yield, the following is a recommended course of action:

    1. Verify that the main crusher is adequately sized for the vertical shaft impactors (VSI). This equipment tends to choke easily due to limitations at the feed point. The rock size exiting the crusher is important for the proper operation of the VSI. 
    2. VSIs should be properly sized for the amount of material feed. A small VSI will not de-cluster the frac sand completely, leaving sand in clusters. On the other hand, a large VSI will shatter the sand, damaging the sand particle shape. The correct size of a VSI should be determined by working closely with the VSI equipment supplier and running sample tests.
    3. Most of the waste sand is normally dumped at the end of the crushing plant.  The addition of a closed circuit at the end of the crushing plant to convey this waste product to a properly sized VSI can de-cluster additional sand grains and increase the product yield.  This VSI works together with a screen to separate the final product.
    4. The proper type of dry screens for final sizing sand grains is very important.  High-angle screens are not recommended due to their inefficiency to screen 40+ mesh.  Considerable good product can be wasted by the improper selection of screens in the dry plant. Low-angle screens with a gyratory reciprocating motion are more efficient in screening 40+ mesh particles.
    5. The wet plant can be improved by additional attrition scrubbers in series if issues with acid solubility are present.  This will contribute to further breaking up clusters of sand grains.  

Producers may not realize how much product is being wasted by poor equipment selection. A particle size distribution test on the waste material is a good indicator of how much good product is being wasted. 

About the Author(s)

Pompeyo D. Ríos

The extent of Mr. Rios’ experience encompasses the design and successful project management of heavy and light industrial plants, both domestic and foreign, including mineral processing facilities, cement and lime plants. He has been responsible for the preliminary layout and detailed engineering of grinding facilities, cement and lime pyroprocessing systems, coal grinding and firing systems, material handling systems, crushing and screening facilities. He is highly experienced in the preparation of bid documents, contracts, capital and operation cost estimates, evaluation of OEM equipment bids, economic evaluation, and feasibility studies. He was directly involved with the equipment layout and design of waste heat recovery (WHR) and co-generating systems. Mr. Rios is fluent in English and Spanish. He holds a BS in Mechanical Engineering from the Universidad Metropolitana, Caracas, Venezuela, and a Masters in Business Administration, Information Systems and Finance/Accounting from Regis University, Denver, CO. He also holds a Certificate in Economic Evaluation and Investment Decision Methods from Colorado School of Mines, Golden, CO.

PEC Consulting Group LLC | PENTA Engineering Corporation | St. Louis, Missouri, USA

How can we help you? Get in touch with our team of experts.

Use of Alternative Fuels in the Cement Industry

By Jagrut Upadhyay

Cement kilns offer very favorable conditions for incinerating waste fuels. High temperatures, long residence times, an oxidizing atmosphere and alkaline environment, ash absorption by clinker, and high thermal inertia all favor the use of Alternative Fuels in a cement kiln. 

There are many benefits tied to the use of alternative fuels in cement kilns; nonetheless, the challenges connected with their application require careful evaluation.

1. What Are Alternative Fuels?

Alternative fuels are non-traditional fuels that have calorific value and can be used as substitutes for conventional fuels such as coal, petroleum coke, oil and natural gas in clinker manufacturing. Typically, alternative fuels are waste or byproducts from industrial, agricultural and other processes. Traditionally, they are managed through landfills, treatment or incineration and come in liquid or solid form.

Liquid Alternative Fuels include solvents, mineral waste oil from used lubricants, vegetable oil and various organic liquids. Solid Waste Fuels come in different forms: used tires, pre-treated industrial and municipal waste, sewage sludge and domestic waste, Refuse Derived fuels (RDF) from pulp, paper and cardboard residues; non-recyclable plastics; Packaging and Textile industry, biomass such as animal feed, contaminated wood and wood chips, waste wood, rice husk, sawdust and sewage sludge, and used carpets.

Figure 1. RDF Fuel Used by a Cement Plant

2. Advantages of Using Alternative Fuels

The main advantages of using Alternative Fuels in the Cement Industry are economic and environmental.

Cement producers strive to reduce their production costs. Fuel accounts for 20 to 25% of the production cost of cement and one viable option is the use of alternative fuels at a much lower cost than conventional fossil fuels. 

The use of waste fuels reduces the carbon footprint that results from using fossil fuels and therefore the overall environmental impact of cement manufacturing operations. It also extends the supply of fossil fuels and is a safe way of absorbing waste which otherwise would present a waste disposal problem. 

The favorable conditions in a cement kiln completely destroy the organic constituents and the inorganic constituents combine with the raw materials in the kiln and exit the kiln as part of the cement clinker without generating solid residues. Free lime in cement clinker acts as a good absorbent of hazardous elements. The cement kiln therefore is a natural incinerator that has a safe thermal environment for the use of alternative fuels. 

Use of alternative fuels in the cement kilns hence helps resolve air pollution problems by eliminating additional emissions which would have resulted from the incinerators while destroying the wastes.

3. Challenges and Limitations

Consistency of the chemistry and continuous availability are two major considerations in the use of Alternative Fuels. All alternative and derived fuels are generated at sources outside the control of cement manufacturers. Therefore, there are always some limitations on the availability of consistent quality alternative fuels in adequate quantities. 

The suitability of Alternative Fuels for use in the cement manufacturing process, effects on plant operation, product and environment need to be studied and established before the alternative fuel is selected. 

The composition of the Alternative Fuel and its availability will determine the extent to which it can be used. 

Invariably, all alternative fuels require pretreatment prior to introducing them in the kiln or pre-calciner. Processing an Alternative Fuel may involve significant capital investment. Modifications to the existing plant equipment and the creation of new infrastructure for the intended use of the alternative fuel will be required. For instance, feeding whole tires requires a complex system and considerable space for implementation. In addition, converting from the use of conventional fuels to alternative fuels will call for adjustments to operating parameters, raw mix design, etc.

Figure 2. RDF Fuel Used by a Cement Plant

3.1. Safety

Safety aspects related to alternative fuels depend on the type of fuel. Safety related issues mainly include handling and storage of fuels that emanate odors or are hazardous wastes. The selection of appropriate feeding points depending on the characteristics of the alternative fuel is also a safety consideration.

3.2. Emissions and Environmental Considerations

The use of hazardous waste as an alternative fuel in cement kilns is regulated by local environmental regulations for the incineration of waste. Emissions of air polluting compounds need to be addressed while considering use of alternative fuels in the cement manufacturing process. 

Emissions of Carbon monoxide, Sulphur dioxide, Nitrogen oxides, Hydrogen chloride, heavy metals such as mercury, lead and cadmium, Dioxins and Furans are major concerns. They are to be controlled below prevailing emission norms irrespective of the fact that whether the manufacturing process uses traditional fuels or alternative fuels. However, this can be achieved with controlled inputs, optimized and stable operation and if required with the installation of a kiln gas by-pass system. 

Cement kilns fired with conventional fossil fuel or with alternative fuels of all types can meet stipulated emission limit.

3.3. What PEC Consulting Can Do

    • Evaluate the suitability of Alternative Fuels.
    • Evaluate the impact on the environment and develop concepts for mitigation measures.
    • Recommend modifications to the existing kiln system for adaptation to the Alternative Fuel.
    • Develop the CapEx and arrangement drawings.
    • If the project is viable, PEC Consulting can subsequently develop the engineering for handling, processing and firing of the fuels into the kiln.

About the Author(s)

The main contributor to this article was Jagrut Upadhyay, Senior Process Consultant at PEC Consulting Group.  Jagrut has a Bachelor of Science in Chemical Engineering, D.D. Institute of Technology, Gujarat University, India.


PEC Consulting Group LLC | PENTA Engineering Corporation | St. Louis, Missouri, USA

How can we help you? Get in touch with our team of experts.

Optimization of Cement Grinding Operation in Ball Mills

By Jagrut Upadhyay

Several energy efficient options for cement grinding are available today such as vertical roller mills, roller presses (typically in combination with a ball mill), and clinker pre-grinders with ball mills. Ball mills have been the traditional method of comminution in the mineral processing industries and continue to operate with old generation classifiers, their maintenance sometimes neglected. This in combination with an inefficient operation translates into high energy consumption and low production. 

The consumption of energy by the cement grinding operation amounts to one third of the total electrical energy used for the production of cement. The optimization of this process would yield substantial benefits in terms of energy savings and capacity increase.

1. Optimization of the Cement Ball Mill Operation

Optimization addresses the grinding process, maintenance and product quality. The objective is to achieve a more efficient operation and increase the production rate as well as improve the run factor. Consistent quality and maximum output with lower specific power consumption results in lower operating costs per unit of production. Optimization can also reduce the cost of liners and grinding media.

The cost of optimization is minimal since inspecting the mill and the resulting modifications — such as re-grading the grinding media or moving the diaphragm are labor elements that can be handled by the plant’s maintenance crew. Upgrading the classifier and baghouse involves capital expenditure with a high benefit to cost ratio.

Optimization is especially important when multiple products are being produced.

2. Operation and Elements of a Closed-Circuit Ball Mill System 

Cement ball mills typically have two grinding chambers. The first chamber is filled with larger diameter grinding media and lined with lifting liners. The first chamber coarse-grinds the feed material and prepares it for the second chamber. The second chamber is the fine grinding chamber. It is lined with classifying-type mill shell liners and provided with finer ball charge. Classifying liners ensure that the ball charge is segregated along the length of the chamber keeping larger grinding media at the beginning of the compartment and smaller media towards the end of the chamber.

An intermediate partition, called the central diaphragm, separates the coarse and fine grinding chambers. The purpose of the central diaphragm is to retain the grinding media in their respective chambers, provide adequate opening for the airflow and, in some special types, regulate the feed to the second compartment.

The mill is equipped with a discharge diaphragm at the end. This diaphragm retains the grinding media in the second chamber and allows the discharge of finely ground material.

Figure 1. Closed Circuit Ball Mill System

Clinker, Gypsum and other desired additives are fed to the ball mill in specific proportions based on the quality requirement. Feed material is ground in the ball mill, discharged and fed to a classifier with the help of a bucket elevator for classification of the ground cement into two streams – coarse and fines. The coarse fraction is sent back to the mill and the fines are collected in cyclones and / or a baghouse as finished product.

The mill is ventilated by an induction fan. The air required for classification is provided by another fan. The fans pull the gases through independent baghouses which clean the vent air and return the cement dust to the system.

3. Auditing Operation

The audit of a closed circuit grinding system focuses on feed material characteristics, grinding progress in the mill, mill ventilation, classification and controls.

Internal inspection of the mill can reveal a lot of important and vital information about the performance of the grinding system such as the separator’s behavior, influence of grinding media and the mill ventilation.

Circuit sample analysis and mill chambers sample analysis indicates performance of the separator and progress of the grinding process along the length of the mill.

The separator is expected to perform in a way that a minimum of the fines is carried in the coarse reject fraction and sent to the mill for regrinding. The separator’s efficiency is determined by drawing a Tromp curve based on particle size distribution analysis. The separator’s performance can be improved by changing the adjustments or replacing worn components. The operational controls are also reviewed for optimized mill operation.

Every element of a closed circuit ball mill system is evaluated independently to assess its influence on the system.

Figure 2 below is a typical example of inefficient grinding indicated by the analysis of longitudinal samples taken after a crash stop of the mill.

Figure 2. Analysis of Longitudinal Samples

The graphical analysis in Figure 2 represents the progress of the grinding process along the length of the mill. In a correct operation the residue will be high initially, falling gradually as grinding progresses, which is not the case in the above graph. Compare this with the milling progress as presented in Figure 4 after optimization.

The following picture shows the condition of the grinding media and the material in one of the grinding chambers of the mill. These observations provide a clear idea of internal conditions — such as a clogged diaphragm or incorrect material level — and present the potential steps for optimization.

Figure 3. Condition in one of the Grinding Chambers of the Mill

4. Results of Optimization

The graphical analysis presented in Figure 4 represents progress of grinding along the length of the mill after optimizing the grinding process. Desired progress of grinding is clearly visible in the graphs.

Figure 4. Analysis of Longitudinal Samples

Use of suitable grinding aids also is recommended to improve grinding. However, it is important to mention that grinding aids should not be considered as optimization tools. It is recommended that all operational and process deficiencies be eliminated and that the system be optimized before considering use of a grinding aid to further improve the process.

Results of the optimization can be measured by multiple parameters such as separator efficiency, specific power consumption, system throughput, and wear rate of grinding media and liners.

Changing the separator to a high efficiency type brings about better residue value (on 45 micron) for the same Blaine. Alternatively, the cement can be ground to a lower Blaine with the same residue, which determines the strength of cement. In most cases the layout permits replacing the separator to a high efficiency type.

An evaluation of the grinding system and operation includes meaningful and critical inspection of all equipment, components and the process parameters by experts.

PEC Consulting can help carry out detailed evaluation of existing grinding systems and their operation and recommend steps for improving performance.

About the Author(s)

The main contributor to this article was Jagrut Upadhyay, Senior Process Consultant at PEC Consulting Group. Jagrut has a Bachelor of Science in Chemical Engineering, D.D. Institute of Technology, Gujarat University, India.


PEC Consulting Group LLC | PENTA Engineering Corporation | St. Louis, Missouri, USA

How can we help you? Get in touch with our team of experts.

Guidelines for Review of General Arrangement Drawings

By Pompeyo D. Ríos

Heading 2

General Arrangement drawings (GAs) should be prepared in sufficient detail to show the location of process equipment, material handling and storage, power distribution, utilities, floor elevations, column lines, maintenance access, stair locations, and overall outline of the structures. GAs are reviewed and approved periodically in their development by all stake holders.

Figure 1. Cement Plant Layout

Prior to starting work on general arrangement drawings, the Owner agrees to a set of codes and design criteria that will govern the design of the new plant. Another key component is a survey of the area, which is especially important for a Brownfield plant expansion. 

The GA review should start in the conceptual planning stages to assure an optimum and economical equipment arrangement. 

Stairs provide the primary access to floors, platforms, walkways and equipment. Equipment located more than 2 meters above floor levels should be provided with stairs and a platform for access. Ladders are not used except where space is limited. It is also acceptable to use a ladder to access nuisance dust filters or some instruments to which stair access is not practical. 

Layouts should provide a minimum 1 meter clearance for walkway areas and maintenance access around equipment. Some equipment requires additional space for maintenance; i.e., removal of components. Standard mandatory height clearance in access platforms needs to be at least 2.2 meters minimum in all areas.

Figure 2. Belt Conveyor Arrangement with Platform Accessible by Stairs

The optimization of conveying equipment to minimize its length needs to be done without compromising the design parameters. Several factors that should be reviewed include the air gravity conveyor’s slope angle, the conveyor’s load angle, speed and radius, chute angles, apron feeder’s load angles, etc.

Figure 3. Belt Conveyor Loading, Transport, and Discharge Arrangement

Various configurations of material transfer chutes are used in plant design. Considerations for chute designs should include the type and characteristics of the material handled such as particle size, moisture content, flow characteristics, and abrasiveness. Chute slope angles are specified in the Design Criteria and shall be steep enough for material to flow by gravity. Chutes having long vertical drops shall be “laddered” down in order to control momentum.

Overhead hoist beams for equipment maintenance should be provided when the equipment is not accessible by mobile hoists or when it cannot be handled manually. Maximum hoist loads must be indicated on the GAs. For example, equipment that should be provided with overhead hoists includes crushers, process fans, clinker breakers, bucket elevators, pumps, air compressors, equipment drives, etc. For large equipment like roller mills, a bridge crane should be provided.

Figure 4. Hoist to Service Bucket Elevator and Belt Conveyor Drives 

Dust suppression systems should be considered when dust is generated. Proper dust suppression systems are normally used at emission points followed by adequate filter sizing and material discharge. GAs are reviewed to ensure that dust suppression/collection parameters in the Design Criteria are being followed.

Figure 5. Dust Control System at Material Transfer

Special attention shall be provided to explosion vents. Design shall ensure that no structure or walkway is close to the expansion wave from an explosion. 

The above are general guidelines. Revisions can have a greater scope depending on regulations and the Owner’s specific requirements. 

The general arrangement review ensures an optimum design that provides an efficient and cost-effective equipment layout, adequate accessibility to install and service equipment, and a safe and dust-free workplace.

About the Author(s)

Pompeyo D. Ríos

The extent of Mr. Rios’ experience encompasses the design and successful project management of heavy and light industrial plants, both domestic and foreign, including mineral processing facilities, cement and lime plants. He has been responsible for the preliminary layout and detailed engineering of grinding facilities, cement and lime pyroprocessing systems, coal grinding and firing systems, material handling systems, crushing and screening facilities. He is highly experienced in the preparation of bid documents, contracts, capital and operation cost estimates, evaluation of OEM equipment bids, economic evaluation, and feasibility studies. He was directly involved with the equipment layout and design of waste heat recovery (WHR) and co-generating systems. Mr. Rios is fluent in English and Spanish. He holds a BS in Mechanical Engineering from the Universidad Metropolitana, Caracas, Venezuela, and a Masters in Business Administration, Information Systems and Finance/Accounting from Regis University, Denver, CO. He also holds a Certificate in Economic Evaluation and Investment Decision Methods from Colorado School of Mines, Golden, CO.


PEC Consulting Group LLC | PENTA Engineering Corporation | St. Louis, Missouri, USA

How can we help you? Get in touch with our team of experts.

Optimizing Operating Costs to Improve Profitability in A Cement Plant

By Narayana Jayaraman

1. Introduction

The Cement Industry is under increasing pressure to become more profitable. Globally, there is overcapacity of production. To be competitive, Production Units need to optimize operations to the maximum possible level so as to lower overall operating costs without having to make major capital investments. The cost of production depends on several factors, such as location, infrastructure, raw materials and labor costs, type of packaging and, most importantly, the cost of fuel and electricity. Average distribution of production costs can be represented as shown in the following example:

Figure 1. Example of Average Distribution of Production Costs

While most factors are location specific, the factor that represents the highest potential for optimization and cost reduction is the actual consumption of fuel and electricity which, in the example above, constitutes 33% of operating costs. Next in line, is the cost of labor and maintenance. 

Optimizing the operation with the aim of lowering fuel and electricity consumption presents the least expensive way to realize savings. In most cases, this does not involve major investments. Even small unitary savings result in significant profits because of production volume of cement manufacturing operations.

2. Fuel and Electric Power Consumption

A modern dry process cement plant, with efficient configuration of the grinding and pyro-processing systems typically consumes less than 700 kcal/kg-cl thermal energy and 100 kWh/mt of electrical energy. 

Cement plants are designed based on the raw materials and fuel samples tested by the equipment supplier. The equipment supplier guarantees are also based on the test results and under perfect operating conditions. In practice, the quality of the actual raw materials and coal varies. If the operating strategy is not adjusted accordingly, it will result in sub-optimal operations and higher operating costs. This is a problem even new plants need to address. 

Older plants have less efficient systems, which compounded with operational and maintenance inadequacies result in higher energy consumption. All plants, new and old thus have a potential for optimization.

3. Plant Operation Benchmarking and Strategy

An energy audit is required to evaluate the operation of a cement plant against the benchmark of similar well-managed plants. After a detailed evaluation of the current raw materials and operating parameters, benchmarks are adjusted to correspond to the specific conditions of the plant. Raw materials are a major variable in this evaluation. Raw mill grindability, for instance, can affect the power consumption of the raw mill section considerably. 

Based on the results of the evaluation, recommendations are made to optimize the operation in either one, two or three levels: 

    • Level 1: Optimize the operation with no or very little investment by adjusting the operational strategy and attending to maintenance areas.
    • Level 2: Improve operation through minor investments and staff training.
    • Level 3: Incur into bigger investments; however, with payback in a short time. 

Once improvement potentials are identified, the management can determine based on cost benefits, the program they want to follow. In most cases, there is enough justification for undertaking Levels 1 and 2.

4. Evaluation Procedure

4.1. Historic Evaluation

The plant operational and stoppage data is collected over the past one or two years. The reasons for stoppages are analyzed in terms of category (mechanical/electrical/ instrumentation/other), duration and frequency of stoppage, etc. in order to isolate the most detrimental causes for stoppages.

The plant performance is also analyzed department-wise. Often, a department’s best performance does not necessarily occur when the plant as a whole performed the best. If we choose the best performance times of each department and make them occur at the same time, the plant performance will show a considerably high level of efficiency. Attempts can be made to make them happen at the same time, which is not an unrealistic target as the departments have indeed performed at that level in the past.

4.2. Thermal Energy

A major part of thermal energy relates to the Pyro-processing system. For a 1 million mt/year clinker production, savings of 10 kcal/kg-cl would result in yearly savings of approximately $185,000, assuming a heat value of 6500 kcal/kg and coal price of USD120/t.

Apart from the savings at the same production levels, the significant advantage in most cases is that this reduction in heat consumption could be utilized for increasing production later when the demand for cement increases by utilizing the spare capacity of the fan created during optimization. 

The audit is done by calculating the heat and mass balance of the Pyro-processing system. The most benefit generally comes from optimizing the cooler operation; cooler loss is thus minimized, which is one of the main reasons for low heat consumption in a modern plant.

In-leakage in the pyro system also contributes to thermal loss, the extent depending upon where the leakage occurs. This is often corrected by maintenance procedures.

Operational strategies are also optimized to improve thermal efficiency. 

Raw materials chemistry is another factor that is optimized to improve the efficiency within the possible limits of raw materials availability.

At each stage of adjustment, heat and mass balance is carried out to record the improvements.

4.3. Electrical Energy

Large fans and Mill drives are the major consumers of electrical energy in a cement plant. 

The fan power in the Pyro-processing system is also linked to the thermal efficiency of the system. Cooler optimization, arresting In-leakage in the preheater, and maintenance of the correct oxygen level are part of the plant audit.

The fans in the grinding systems depend on the system configuration, which cannot be altered in an existing plant. However, the operation itself can be optimized for reducing the airflow and improving production, which contribute to the kWh/t of fans.

The mills are large consumers of power as well. In the case of ball mills, optimization of the mill charge helps to minimize the power consumption of the mills. In the case of vertical roller mills, inspection of the mill internals and adjustments in the operation will bring about an improvement in the energy consumption and for production increase.

4.4. Analysis

The data collected is analyzed and the findings discussed with the plant operating personnel and plant management. 

As a first level, a field visit by an experienced consultant will itself reveal several potential areas for improvement, such as leakages, damaged or nonfunctioning sluice valves in a preheater, gaps in the cooler grates, etc., most of which can be rectified by plant maintenance t without additional investment. This level also includes process adjustments, such as optimizing the oxygen levels, raw mix chemistry, burner, etc. 

As a second level, minor investments in the form of replacement of worn or damaged parts, minor duct modifications, insulation, etc. will contribute to improvement in the economy of operations. 

In the third category, higher levels of investment will be considered. Examples are changing preheater cyclones to low pressure type, changing to mechanical transport, additional of new instrumentation and control systems.

The identified steps for improvement are classified according to the investment requirements and the recommendations presented to the cement plant.

5. Implementation

The cost-benefit analysis of the recommended steps should assist the cement plant strategize the implementation plan. Since the improvements are to be monitored all the way to determine the next steps, a constant involvement by PEC Consulting will help the plant on this effort. 

Generally, the plant personnel are deeply involved in the day–to-day running of the plant and have very little time to do a systematic evaluation of the plant operation. PEC Consulting can contribute by working with the plant personnel and carrying out a scientific study of the operations. A combination of theoretical calculations and practical observations and feedback from the plant personnel would collectively provide a valuable input to the clients for achieving better performance of the plant, lower energy bills and a potential for higher production when the demand for cement increases.

About the Author(s)

Narayana Jayaraman

Mr. Jayaraman has over 48 years of experience in the cement industry with expertise in plant conceptualization, layout, various operating systems, process calculations, production optimization, and Waste Heat Recovery (WHR) based power projects for cement and lime plants. He has led several studies to estimate realistic waste heat for power generation. He has had in-depth exposure to the technical, economic, and commercial aspects of large cement projects, and extensive experience in the upgrade and optimization of existing plants. He earned a BS in Mechanical Engineering from Osmania University, Hyderabad, India, and an MS in Mechanical Engineering from the Indian Institute of Technology, Kharagpur, India.


PEC Consulting Group LLC | PENTA Engineering Corporation | St. Louis, Missouri, USA

How can we help you? Get in touch with our team of experts.

Coal Grinding and Firing Systems – HAZOP Analysis

By Jagrut Upadhyay

A Process Hazard Analysis (PHA) is a key element of a Process Safety Management (PSM) program. It analyzes potential risks to personnel operating in an industrial environment.

A PHA is a thorough detailed systematic approach to finding potential hazards in an industrial plant. It includes an analysis of the equipment, instrumentation, utilities, human actions, and external factors which could be potential hazards.

One of the techniques of a PHA used to identify hazards and operability problems is the HAZOP (Hazard and Operability) study which can be performed on both a new or operating coal grinding and firing system.

This article describes activities and elements involved in a HAZOP study of a coal grinding and firing system.

1. Introduction

The handling, preparation, storage, conveying and firing of ground solid fuel have inherent operating risks. Various qualities of coal are used as fuel. Due to the combustible properties of coal in general, safe handling is important during the entire process.

Accidents are mainly caused by the unintended release of energy caused by fire and explosion. A HAZOP study identifies situations where such release of energy may occur. It also identifies and estimates the potential severity of damage and recommends mitigation measures.

A HAZOP study of a typical operating Coal Grinding and Firing System encompasses the following areas:

    1. Fuel handling and storage – Raw coal receiving, storage and handling.
    2. Fuel preparation – Raw coal grinding.
    3. Fuel conveying – Fine coal storage and conveying for an indirect firing system.
    4. Fuel conveying – Fine coal conveying for a direct firing system.

2. Methodology

A HAZOP study is generally performed using a comprehensive and widely used methodology in the industry, known as “What –If”. The technique is usually performed by a team of 3 or 4 experts. By using relevant documents, process knowledge and experience, the team develops “What-If” questions around all possible deviations, upset process conditions, equipment failures and potential human errors. Potential hazards, operational problems and design faults are thus identified. The team evaluates the consequences of each deviation and, depending on what safeguards are available in the present system, decides upon recommendations or actions for preventing such occurrences.

The HAZOP Study of the Coal Grinding and Firing Systems addresses the following aspects: 

  1. The hazards of the coal grinding and firing process.
  2. Engineering and administrative controls applicable to the hazards and their interrelationships.
  3. Detection methods (Hydrocarbon detectors & gas analyzers) and continuous process monitoring.
  4. Consequences of failure of engineering and administrative controls.
  5. Human factors affecting the operation.
  6. A qualitative evaluation of safety and health effects of failure of controls on employees.
  7. The identification of any previous incident which had a potential for catastrophic consequences.

3. Documentation

The following documents will be required for a HAZOP study:

    • Layout and G A drawings.
    • Equipment lists.
    • Process flow sheets and Process and Instrument Diagrams.
    • List of Process control loops and Process and Safety Interlocks.
    • List of Instrumentation and Alarms and Process variables with all limits.
    • Operating procedures and work instructions for various modes of operation.
    • Maintenance procedures and work instructions.
    • Documentation on all auxiliary systems and Fire hydrant system.
    • Raw Coal and Fine Coal analysis.
    • Method to control bypassing the Interlocks and Alarms.
    • Hazardous Area Classification.

4. Staffing

A HAZOP study is performed by a team whose members are process and maintenance engineers with specific knowledge in the operation and maintenance of coal grinding and firing processes. At least one member of the team must be knowledgeable in the specific process hazard analysis. Operation and maintenance engineers as well as coal mill operators participate in structured brainstorming to look for deviations from the design performance.

5. Results

A HAZOP study identifies potential deviations which had not been experienced in the coal grinding and firing system. The ultimate aim of a HAZOP study is to achieve the following:

    • Ensure that the coal grinding and firing system can be started, operated and shut down safely.
    • Recommend appropriate changes to the process design or its operation that increase safety or enhance operability.
    • Consider existing safety interfaces with operation software including installations such as the Coal mill baghouse, fine coal storage and dosing system, fuel firing systems, inertization systems, etc.
    • Derive the recommendations and actions to eliminate potential occurrences identified as risks. 

A HAZOP analysis is required whenever there have been modifications/changes to the equipment, operation and maintenance procedures, operating parameters, environmental conditions; and in the case of incidents or near misses. Therefore, a HAZOP analysis also provides an opportunity to develop a system to manage Changes effectively.

6. Report

The HAZOP Study Report provides comprehensive results compiled in specific formats and clearly lists the actions to be taken by the plant management. Table 1 is a typical analysis format used to record the findings.

Table 1. Typical HAZOP Analysis Format

About the Author(s)

This article was presented by Mr. Jagrut Upadhyay, Senior Process Consultant at PEC Consulting.


PEC Consulting Group LLC | PENTA Engineering Corporation | St. Louis, Missouri, USA

How can we help you? Get in touch with our team of experts.

Cement Import Distribution Terminals

By Christian A. Benavides

1. Cement Import Terminal Scoping Study

For the implementation of a new Cement Import Terminal, the best practice begins with hiring an experienced consultant to perform a Feasibility Study. As a preliminary step, prior to beginning the feasibility study, a scoping study should be executed. The Scoping Study will examine the fundamental aspects to the project.

The Scoping Study should focus on:

    • Preliminary Communications with Port Authority and Government Agencies.
    • Permitting.
    • Preliminary FOB Cement FOB Pricing for Region and Availability.
    • Examination of Possible Site/s location/s.
    • Preliminary Project CapEx, OpEx, Simple Economic Analysis.
    • Preliminary Conceptual Designs.
    • Preliminary Examination of Infrastructure and Logistics.
    • Social and Environmental hurdles.
    • Market Study (if applicable).

The Feasibility will advance elements of the Scoping Study and will additionally cover: 

    • Source pricing to Cement Supply and Transport.
    • Obtaining bids from Vendors and Contractors.
    • Develop Design Criteria, Basic Layouts and Specifications for the Port Facility terminal.
    • Project Schedule and Execution Strategy.
    • Risk Assessment.
    • ROI.

The primary role of the Consultant will be to gather and analyze the data for the Study, while the Owner takes an active role in advancing communications with all relevant stakeholders and consultants, which may include the following: 

Port Authority

Local Government Agencies

    • Consultants.
    • Legal Counsel.
    • Vendors/Contractors.
    • Cement Suppliers.
    • Transport Companies.
    • Unions/Stevedores.

2. Facility Sizing and Design for Optimization

In order to optimize operations to improve margins per ton of cement, it’s important to understand all the variables. These variables need to be examined and weighed against each other to determine the best facility type, size and level of automation. The variables considered include:

    • Cement Shipment Size.
    • Product Turnover .
    • izing of Unloading Equipment.
    • Storage Size Requirements.
    • Facility lot Size and Berth Capabilities.
    • Port Ship Size Limitations.
    • Port Fees.
    • Maintaining Separation of Deliveries.
    • CapEx, OpEx, and Desired Return on Investment.
    • Automation (CapEx) vs. Labor Costs (OpEx).
    • Environmental Requirements.
    • Zoning Restrictions.
    • Any other variable that needs to be considered for the site.

3. Cement Import Termianl Options

3.1. Flat Storage Option

The Cement Flat Storage provides an excellent solution for a low-CapEx storage. Certain factors need to be considered and weighed to determine if a Flat Storage is desirable:

    • Labor costs.
    • Lease costs.
    • Availability of sufficient land area.
    • Lower CapEx is a requirement for project approval.
    • Compartmentalizing.
    • Flexibility with expanding capacity.

Figure 1. Typical Flat Cement Storage with Front-End Loader Reclaim

Reclaim for Flat storage can be handled in several ways. If labor costs are low, it would be preferable to have front loaders that feed a hopper and bucket elevator to fill the truck loadout bins. In locations where labor costs are extremely high, there may be value in the installation of fluidized flooring.

Figure 2. Reclaim for Flat Storage

3.2. Dome Storage Option

Domes provide a good solution for a fully automated operation. There are various configurations that can be designed for specific operational needs. The capital expenditure is expected to be higher than that of a flat storage, but there are benefits of a Dome Storage such as:

    • Large live storage capacity.
    • Full Automation.
    • Reduced labor costs.
    • Smaller footprint.

Figure 3. Typical Dome Storage System

In cases where multiple products are required or deliveries need to be kept separate, multiple domes or combination of dome and silos would need to be considered.

Figure 4. Typical Cement Dome Storage

3.3. Silo Storage Option

Typically, a silo storage is a preferred method for dispersing product to local markets that cannot be accessed by large bulk carriers. Silo storages are only seen along rivers and lakes where small 5-10kton barges are used for transporting from a production plant. One of the benefits of this type of storage is that it takes up a very small footprint; however, the capital cost to build per ton of storage capacity is the highest.

Figure 5. Cement Silo Storage with Truck and Rail Disbursing

3.4. Floating Storage

Converting an older bulk carrier into a floating storage is a low-cost storage option, however not all ports are warm to this concept. The ship unloader can be mounted on rails on the vessel deck and used to unload from the incoming vessel as well as to withdraw from the floating storage to the truck-loading bins on shore. Either a Handymax or Supramax ship could be converted and designed for a storage capacity of 40,000-50,000 metric tons in 5 or 6 compartments (holds). This is by far the most economical option. 

It’s important to begin early discussions with the local port authorities to discuss this option before making any investment. A permanent berthing space would need to be obtained from the Port Authority within a reasonable distance (300 m or less) from the truck loading bins on shore.

Figure 6. Floating Storage Example

Figure 7. Floating Pipeline to Truck Loading Bins 

3.5. Unloading Equipment

Bulk carriers can be unloaded through various methods. The two preferred methods are by either screw or pneumatic conveying. Typically, screw to belt is common on docksides where fixed equipment is allowed which represents an overall lower Operation cost to unloading. Pneumatic is preferred in cases where the dock face is considered to be shared and unloaders, whether mobile or barge mounted, must be moved after unloading operations have been completed.

Figure 8. Barge Mounted Unloader 

Some of the major considerations for ship unloader selection and design are: 

    • Reach requirements.
    • Rate of unloading.
    • Distance of transport.
    • Mobility needs.

Figure 9. Floating Storage Rail Mounted Unloader

Ship unloading manufacturers can create custom solutions, however, it is important to understand that keeping the design as standard as possible offers cost savings to the project.

Figure 10. Dockside Screw Rail Mounted Unloader

Figure 11. Pnuematic Rail Mounted Unloader

About the Author(s)

The main contributor to this article was Christian A. Benavides, Construction Technical Consultant at PEC Consulting Group LLC, St. Louis, Missouri, U.S.A.


PEC Consulting Group LLC | PENTA Engineering Corporation | St. Louis, Missouri, USA

How can we help you? Get in touch with our team of experts.

Plant Commissioning

By Jagrut Upadhyay

When done systematically and in coordination with the plant process, the commissioning process of a plant results in a fully functional and lucrative operation 

This article describes elemental pre-commissioning and commissioning activities for achieving the delivery of a quality project and the smooth start-up of a new plant. 

The Commissioning Team must verify proper erection and oversee testing of each piece of equipment according to equipment manual and specifications, and check-out procedures developed for the project. Incomplete checks will result in frequent stoppages and will eventually lead to poor plant availability, delayed commissioning, and over run of the project cost. 

For example, unflushed compressed air lines might cause failures of pneumatically operated instruments and equipment. Likewise, unflushed cooling water lines could adversely affect the equipment and the cooling water system. 

The role of commissioning involves: 

    1. Structuring the commissioning teams.
    2. Pre-commissioning activities.
    3. Commissioning and performance testing.

1. Structuring the Commissioning Teams

Lorem ipsum dolor sit amet, consectetur adipThe following teams are responsible for working together in order to achieve a safe, smooth and trouble-free start-up. Schedules need to be programmed to allow for a 24/7 uninterrupted operation. iscing elit, sed do eiusmod tempor incididunt ut labore et dolore magna aliqua. Ut enim ad minim veniam, quis nostrud exercitation ullamco laboris nisi ut aliquip ex ea commodo consequat. Duis aute irure dolor in reprehenderit in voluptate velit esse cillum dolore eu fugiat nulla pariatur. Excepteur sint occaecat cupidatat non proident, sunt in culpa qui officia deserunt mollit anim id est laborum.

1.1. OEM’s Team

Plant management should have a team of Original Equipment Manufacturers’ (OEM) commissioning engineers ready at the plant prior to no-load tests to ensure that sequential interlocking, and all safety instruments and control systems are in place.

1.2. Owner’s Erection and Commissioning Team

The Owner’s team should be composed of the plant’s experienced Process, Mechanical, Electrical / Instrumentation engineers as well as Central Control Room operators. 

The Owner’s team should be supported by Senior Consultants from the Consulting Firm supporting the commissioning and start-up of the plant.

2. Pre-Commissioning Activities

    • Analyses of raw materials and fuel.
    • Procurement of critical commissioning spares.
    • Ensure availability of all documentation on equipment and systems.
    • Mechanical and Electrical check-out according to procedures.
    • Construction punch list completion.
    • Cleaning of utility lines.
    • Complete preliminary check.
    • Testing of Electrical and Instrument controls.
    • Verification of “Site Start & Stop” and “CCR Start & Stop.”
    • Calibration and operation of dampers and control valves. 
    • Calibration of weighing equipment. 
    • Group trials of equipment. 
    • Procurement of Portable Measuring Instruments. (Process parameters measuring Instruments).
    • Ensuring the laboratory test equipment is operational.

Equipment trial runs should be done continuously for a few hours; the equipment is then inspected and corrected, if required.

3. Commissioning and Performance Testing

3.1. General Steps Involved in Commissioning

    • Ensure good health of motors and electrical devices.
    • Group sequence starts for each process area.
    • Follow the correct heating cycle for the pyroprocessing equipment.
    • Plant Start-up on load.
    • Plant operation under guidance from OEM’s Commissioning Engineers.
    • Tune PIDs and control loops.
    • Record of process parameters in log sheets.
    • Manage stoppage and re-starts of each processing areas.
    • Review and understand the following documents with respect to system, product quality and performance guarantee:
      • Suppliers’ Instruction Manuals.
      • Equipment Specification List.
      • Flow Sheets.
      • Raw Material Analysis.
      • Instrumentation ranges.
      • Instrumentation Alarm / Recorder / Controller scheme.
      • Start – Stop – Operation – Safety Interlock logics.
      • Process Parameters to be maintained for optimum operation.
      • Refractory Drying schedule (from refractory supplier).
    • The joint review by the OEMs’, Owner’s, and Consultant’s teams also includes commissioning protocols, sequences, control scheme and interlocks.

After the erection team clears the equipment and no – load trials with a certificate of completion, the Commissioning team will take over the plant for commissioning. Commissioning is a controlled activity well-coordinated with the mechanical, electrical and quality control (laboratory) teams. All the guaranteed parameters are measured during the same commissioning trial. Energy consumption is measured at rated production levels according to the agreed test procedures with the OEMs. 

Commissioning and performance testing establishes if the plant meets the production guaranteed values. It also serves as a release of the OEMs’ obligations with respect to meeting their guarantees. The plant is handed over to the production team to start operations once a Commissioning and Performance Certificate is issued.

About the Author(s)

This article was contributed by Jagrut Upadhyay, Process Consultant at PEC Consulting Group in St. Louis, Missouri.


PEC Consulting Group LLC | PENTA Engineering Corporation | St. Louis, Missouri, USA

How can we help you? Get in touch with our team of experts.

Coal Grinding Systems – Safety Considerations

By Gerald L. Young

Most rotary kilns use solid fuels as the main heat source to produce cement clinker.

A training program should be developed and extensive training for coal mill system operators provided on a regular basis. Safety considerations, such as the prevention of fire or explosion are of utmost importance as is the knowledge of how to proceed under normal conditions. The training program should include the development of an operating manual which should be updated with new procedures as situations occur.

1. Safety Aspects

1.1. Solid Coal Unloading, Storage, and Reclaiming Areas

A major hazard associated with coal handling facilities is the possible formation of an explosive atmosphere originating from accumulation of methane and coal dust especially in enclosed areas or tunnels such as rail unloading facilities. Walls should be washed down frequently to prevent dust accumulation, and welding or electrical repair work should not be conducted in an enclosed area during unloading operations or if methane or coal dust is present. Smoking, open flames, and other potential ignition sources should be prohibited in any areas in which coal is being handled or processed. 

Fires that start around the edges of coal storage piles should be removed with a front end loader, spread in a location away from the coal storage area, and allowed to cool. Water should NOT be sprayed on a smoldering coal pile. The degree of wetness in a coal storage pile is known to influence spontaneous heating. 

Belt magnets and metal detectors on coal belts must always be operating properly. Pieces of metal can cause sparks or become overheated which can ignite a fire or initiate an explosion. Scrap metal in a coal mill is particularly dangerous during mill shut down or start up.

1.2. Coal Mill Operation

Fires or explosions most likely occur during startup and shutdown of a coal mill system. If a small amount of coal remains in the mill after it is shut down, it slowly increases in temperature. If the pulverized coal undergoes spontaneous heating and the coal mill is restarted with hot embers present, an explosion or fire is possible. Although this does not happen often, the chances increase when a coal mill is frequently shut down and then restarted.

A coal mill system that goes down, particularly under load, must be treated with extreme caution. In several cases, fires or explosions have occurred when an employee opened an inspection door. Air admitted to the system allows oxygen to reach a smoldering pile of pulverized coal that then ignites explosively. Also, an inrush of air may create a pulverized coal dust cloud that explodes. 

1.3. Accumulations of Pulverized Coal Dust

All leaks, spills, and any accumulations of coal or coke dust must be cleaned up promptly around coal mill grinding and firing systems because of the potential for spontaneous combustion. Small piles or layers of coal or coke dust may spontaneously heat and start a fire.

Coal dust spills or leaks must be cleaned up or repaired as soon as it can be safely done. A potentially serious problem exists if coal dust is allowed to accumulate inside a building or enclosure, for example around an unloading facility or because of a leaking coal conveying line. If large accumulations of dust exist and a small explosion occurs, the dust build-up can be dispersed into the air as a result of the relatively minor first explosion and then produce a very large secondary explosion.

When coal is freshly pulverized, volatile gases such as methane can be released and the result is no longer a coal dust/air mixture but what is termed a hybrid mixture.

1.4. Coal Mill Temperatures

Coal mill hot air inlet temperatures should never be more than 600F and the outlet temperature should not exceed 200°F on Raymond coal mills. If the flow of raw coal to the coal mill is interrupted for any reason (for example: plugging, failure of the coal feeder, etc.), the outlet temperature of the coal mill can quickly climb to dangerous levels. The risk of explosions or fires can be extreme when the coal mill inlet temperature increases to more than 600°F or the outlet temperature is more than 200°F.

1.5. Velocity in Ducts and Burner Pipes 

Fuel efficiency would tend to dictate that the airflow should be varied as the coal feed rate varies. However, velocities in ducts or conveying lines must be at least 5000 fpm (25 meters per second), which has the practical effect of limiting how much the airflow can be varied without reducing the velocity below safe levels.

Burner pipes must be designed to maintain a minimum tip velocity of 8500 fpm (45 meters per second). Velocities less than 8500 fpm substantially increase the risk of the coal flame propagating into the burner pipe and potentially through the conveying lines to the coal mill causing substantial damage to the equipment.

2. Common Causes of Fires or Explosions in Coal Systems

2.1. Combustible Gases 

Coal may contain trace amounts of gases such as methane. When coal is handled, it can release some of these gases. Methane concentrations in coal unloading systems, particularly in enclosed areas such as tunnels, elevator housings, and bins can accumulate to dangerous concentrations. Smoking, cutting, welding, or any source of open flame or high heat (such as a light bulb that could break and result in an electrical arc) should be strictly prohibited in coal handling areas.

2.2. Spontaneous Combustion

Oxidation at the surface of a coal particle –which is most active when the coal has been freshly pulverized – and condensation of water onto the coal are reactions causing heat that can lead to spontaneous combustion. 

The ease with which coal will oxidize is extremely variable. The total exposed surface area is important because, when more fresh surface is exposed, oxygen has a higher chance of uniting with the coal with the result that the total heat liberated in a given time for a given weight of coal will be substantially greater. When water condenses, it releases heat which can be a significant factor in the initial increase in temperature of a coal dust mass. However, oxidation is how the coal ultimately reaches its ignition temperature. 

Spontaneous combustion is primarily oxidation occurring on a fresh surface of a coal particle. The rate of oxidation increases rapidly as the temperature increases. For some coals a temperature increase of 20°F (10C) can double the rate of oxidation. If heating from oxidation occurs in a mass of coal dust, the ignition temperature of the coal can be reached quickly if enough oxygen is present. 

When a build-up of coal dust is allowed to occur, the coal will begin to heat for reasons just explained. Therefore, it is important that all coal dust is immediately cleaned and dust is not allowed to build-up in piles.

2.3. Debris in the Coal Mill

Every effort must be made to prevent scrap metal and other spark producing debris to enter the coal mill system. Pieces of metal in the coal mill can also be heated to temperatures high enough to start a fire or explosion by being in the mill while it is in operation.

Solid fuel that spills over the bowl and into the area below the bowl can cause a fire since it is exposed to the hot drying air entering the coal mill. The coal mill scrapers will usually sweep the fuel pieces around to the debris chute and discharge them; however, a fire is likely to occur if a coal buildup occurs at the hot air inlet to the mill.

2.4. Hot Surfaces

Hot surfaces such as hot bearings, cutting, or welding can start a coal dust fire or explosion. Any unusual temperatures must be reported immediately and steps taken to solve the problem. Cutting and welding around the coal mill system should only be done under strict supervision by qualified personnel. The system should be inerted or washed down with water prior to cutting or welding.

2.5. Coal Dust Explosions

A coal dust explosion will occur if the following three conditions exist:

    • The concentration of coal dust in the gas mixture is within the explosion limits.
    • The oxygen content in the gas mixture is sufficient for an explosion.
    • There is sufficient thermal energy to initiate an explosion. 

Theoretically, the absence of one of any one of these three factors would be enough to prevent a coal dust explosion. 

However, it is preferable to eliminate two or, possibly, all three factors. The thermal energy required for initiating an explosion could originate from several sources: 

    • Spontaneous combustion or self-heating of the coal. 
    • Overheating of the coal by hot gases used for drying that are too hot. 
    • Overheated machine parts, such as hot bearings. 
    • Metal entering the coal mill with the coal can cause sparks or become hot enough to start a fire or explosion.

3. Emergency Considerations

On a coal grinding and firing system, maintenance work or inspections that require opening equipment should only be performed when given specific instructions and under the direct supervision of authorized personnel. Cutting or welding around or on a coal firing system can result in fires and explosions. Opening an inspection door on a coal grinding system can provide oxygen to smoldering, powdered coal and result in fires or explosions. Use extreme caution when opening an inspection door. Do not poke or disturb any coal accumulations if there is any evidence of heat, smoke, or glowing embers. Allow the system to cool further and then check again as necessary. When you are convinced everything is OK, remove any accumulations in small amounts. Before working on or around coal firing systems, the system must be inerted or washed down with water to be sure powdered coal can not ignite.

About the Author(s)

 Gerald L. Young

Jerry has authored or co-authored more than 25 papers that cover cement manufacturing and emissions control. He has conducted cement plant audits and feasibility studies for new cement plants and plant expansions. He has a BSc degree in Chemistry from Missouri University of Science and Technology, Rolla, MO, and a Master’s degree in Management from the University of Redlands, CA.


PEC Consulting Group LLC | PENTA Engineering Corporation | St. Louis, Missouri, USA

How can we help you? Get in touch with our team of experts.

Evaluation of Process Plant Equipment Tenders

By Pompeyo D. Ríos

Equipment tenders submitted by Original Equipment Manufacturers (OEMs) should be methodically evaluated. Tenders are first evaluated against process and technical mandatory parameters as specified in the Request for Quotation (RFQ). Bidders who do not meet design criteria are notified of discrepancies and given the opportunity to rectify them within a reasonable amount of time.

A point system — which measures several pre-agreed technical, commercial, and financial parameters – is a reliable tool used to impartially measure and grade tenders. Equipment price, ease of installation, operating costs and other factors are considered in the selection process.

1. Point Rated Evaluation

A point-rated evaluation system is used to determine the relative merit of each proposal. Point-rated criteria identify value-added factors and provide a means to assess and compare the offers. 

Key parameters like capacity, flow rates, brake power, power consumption, and fuel consumption are evaluated. Key parameters must be agreed upon by the evaluation team before the evaluation process starts. 

The following formulae could be used to calculate the score:

    • When the minimum value is the most attractive value, score = avg/value x 100.
    • When the maximum value is the most attractive value, score = value/avg x 100.

Note. “avg” is the average value of all the OEM offers and “value” is that which has been provided by the OEM supply being evaluated.

For example, to evaluate an ID fan for a vertical roller mill break power.

Table 1. ID Fan Brake Power per Bidder

First the average power value is calculated and this value is equated to 100. The average brake power value for the table above is 727 kW. 

In this case the lowest motor power is the most attractive feature. 

Then use the following formula: 

Score = 727 / 820 x1 00 = 88.66

The score for all three bidders is listed below:

Table 2. Values & Scores of All Bidders

In this case, Bidder B has the highest score, 110.10, because it is providing the lowest operating power demand for the fan (we are looking for the most efficient fan for the vertical mill system).

This process is followed for each parameter to be evaluated. A weight is assigned to each parameter according to its importance, and each parameter score is multiplied by its weight. 

Weights for each feature are agreed upon before the evaluation process starts. 

Below is an example of a Clinker Cooler evaluation:

Table 3. Clinker Cooler Evaluation

After every parameter is analyzed and rated, all the values are added. In this case, the cooler provided by Bidder B has the highest technical score of 102.59.

2. Project Cost

The equipment tender price not the sole indicator of equipment cost. There are other factors to be considered in addition to the tender price: i.e., the life cycle of the equipment, installation cost, construction of supporting facilities and operation costs. 

Equipment and installation costs should be calculated for each bidder and then equalized for comparison purposes. An economic analysis must be made of the entire life cycle of the plant, not just the initial equipment purchase price. In some cases less expensive equipment may in the long term end up costing more due to higher installation and operating costs.

The table below shows operating cost comparisons of power and fuel for a cement plant: 

Table 4. Power Consumption for a Cement Plant

Table 5. Fuel Consumption for a Cement Plant

Power and fuel costs are added in the table below. A score is calculated using formula avg/value x 100, where “avg” is the average total operating cost/year.

Table 6. Score Calculated per Bidder

3. Bidder Overall Evaluation

Point-rated criteria, project cost, and operating cost are incorporated into the overall evaluation. Weight is assigned to each parameter:

Table 7. Parameters & Weight Factors Assigned to Each Bidder

Bidder B has the highest score, 101.86, followed by Bidder A. Bidder C score, 97.15, is below average. This evaluation is not definitive, but serves as a tool for top management to make a final decision. There are other factors that, although not quantifiable, should be considered, like client-supplier relation, services near plant location, technology, commercial terms, etc.

About the Author(s)

Pompeyo D. Ríos

The extent of Mr. Rios’ experience encompasses the design and successful project management of heavy and light industrial plants, both domestic and foreign, including mineral processing facilities, cement and lime plants. He has been responsible for the preliminary layout and detailed engineering of grinding facilities, cement and lime pyroprocessing systems, coal grinding and firing systems, material handling systems, crushing and screening facilities. He is highly experienced in the preparation of bid documents, contracts, capital and operation cost estimates, evaluation of OEM equipment bids, economic evaluation, and feasibility studies. He was directly involved with the equipment layout and design of waste heat recovery (WHR) and co-generating systems. Mr. Rios is fluent in English and Spanish. He holds a BS in Mechanical Engineering from the Universidad Metropolitana, Caracas, Venezuela, and a Masters in Business Administration, Information Systems and Finance/Accounting from Regis University, Denver, CO. He also holds a Certificate in Economic Evaluation and Investment Decision Methods from Colorado School of Mines, Golden, CO.


PEC Consulting Group LLC | PENTA Engineering Corporation | St. Louis, Missouri, USA

How can we help you? Get in touch with our team of experts.

Building Cement Plants With Used Equipment

By F. M. Benavides, N. Jayaraman, and K.R. Schweigert 

Utilizing used equipment to build a cement plant is not always economically attractive as it may appear at face value. Although the cost of the equipment appears to be favorable, there are many factors which need to be considered in the capital cost analysis (CapEx). In most cases, the equipment is sold in place at the plant being dismantled. This is true with most major process equipment. The buyer carries the cost of dismantling, transporting, and reassembling the equipment. The buyer is also responsible for all Customs imposed export and import procedures, duties and taxes.

The analysis of the feasibility of utilizing used equipment should consider the following points:

1. Financial Challenges

1.1. The Entire Risk is on The Owner

Most equipment is sold on an as-is where-is basis; hence, a detailed inspection and assessment of the equipment is necessary. The seller will not provide guarantees of any kind (capacity, completeness, equipment condition warranties, etc.). The risk entirely rests with the Owner and it is high considering the ratio of equipment cost to overall investment costs, which amount to hundreds of millions of US Dollars.

1.2. Performance Guarantees and Technical Support

No one, including the original OEM, will likely be prepared to provide a performance guarantee in terms of capacity, energy consumption, or quality of the equipment as is normally obtained with new equipment.

1.3. Schedule Risks

More than likely, not all necessary plant components will be available with the existing used plant. Therefore, new parts have to be identified, ordered and then assembled. In this case, there is no advantage on the project schedule compared to using all new equipment. Production delays due to faulty equipment will result in projected cash flows not materializing because of implementation issues which may counter the savings gained from the procurement of used equipment.

2. Technical Challengues

2.1. Capacity of The Plant

Capacities of the available used equipment will dictate the new plant capacity rather than the preferred capacity according to the determination of the feasibility study.

Unless all the used equipment comes from a single process line sized for the capacity of the new line and utilizing similar raw materials and fuels, matching the equipment to the new site may require significant modifications. Buying individual equipment is even more challenging and requires a highly skilled process engineer to match equipment to requirements. Process flow sheets and equipment lists need to be developed to prepare a “shopping list” of complementary equipment. If a complete line (raw mill through clinker cooler discharge) is identified, the process engineer needs to identify the modifications required to adjust for the conditions of the new site, such as the difference in elevation which has an effect on the amount of process gases handled.

2.2. System Configuration

Different systems such as raw grinding, coal grinding, pyro-processing system, storage and material handling systems, may or may not be the Owner’s optimal choice for the new plant. The Owner will have to make do with what is available.

2.3. Electrical Systems & Controls

Highly qualified electrical and control engineers need to evaluate the equipment and determine suitability for the new site conditions. If applicable, it is likely that a power distribution system will still need to be designed and new instrumentation and control system will be required for the new plant.

If the source of the equipment has different voltage and frequency ratings, it is most likely that the electrical drives will not be usable as the equipment would have been designed for different motor speeds.

2.4. Specific Transportable Equipment

While heavy equipment is economical to transport due to its high value, equipment such as cyclones, bins, process ducts is not economically transportable even if in good condition. Such equipment is made of thin plates susceptible to damage. Furthermore, the transport costs are based on volume rather than weight and therefore the costs will be disproportionately high.

2.5. Documentation

Documentation is one of the biggest issues with the concept of building a plant with used equipment. Documentation is very important for relocation, reassembly, and also for future maintenance. Generally, the documentation is unorganized and incomplete which becomes a challenge during reconstruction. Specifically, the structural drawings designed for equipment loads, if available, need to be reexamined. More than likely, the soil conditions and wind and earthquake loads at the new location are different and therefore the foundations and structures will have to be redesigned. The availability of equipment drawings is critical to the success of the project. If equipment drawings are not available, it will be necessary to request drawings from the OEMs to avoid the tedious work of taking dimensions in the field.

2.6. Dismantling of Equipment

Once used equipment is located, a team of engineers with extensive experience in equipment maintenance needs to be deployed to the site to evaluate its condition. Expertise in rotary kilns, mills, process fans, coolers and other major cement plant equipment is required to do this type of evaluation. It is rare to find used equipment that was shut down and maintained in good condition. Most companies quit doing maintenance on equipment if they know it will be shut down. If the equipment is idle for a long period of time, certain components will deteriorate. In this case, considerable effort and planning are required to ship equipment to maintenance shops to be overhauled.

A skilled team of professionals should be in charge of dismantling the equipment. Match-marking and adding identification to facilitate reassembly, which is best done by the same team. The cost of dismantling depends on the country where the used equipment is located, which is most likely in western countries where costs are high. Often the equipment is still in place which will require hiring a local contractor to disassemble and ship to the new location. A company representative will need to be present to make sure this is done correctly.

Steel structures cost more to disassemble and reassemble compared to new fabricated structural steel sourced in Asia.

2.7. Problems With Identifying Missing Components

Ancillary Equipment: Unless a complete cement line is found that matches the desired production rate and elevation of the new site, purchasing individual equipment is “hit and miss”. Some equipment can be found, but others will have to be purchased new. Usually auxiliary equipment is not worth the effort to purchase used. 

This is technically the most difficult aspect of relocation projects. Several components could be missing or damaged during the shut-down period. Initial inspection or due diligence generally covers an overall visual inspection and does not include detailed inspection of each and every equipment and its internals. In many cases, parts are proprietary items that need to be procured from the OEMs. Such spares are expensive and will be disproportionate in cost to the value of the purchase price of the used equipment.

2.8. Transit Damage

Transit damage risk will be carried by the buyer since the dismantling and packaging will be undertaken by the buyer’s contractor.

3. Conclusion

Transportable equipment is best limited to major heavy equipment. Parts made of thin plates or embedded in the concrete such as kiln base plates are either likely to be damaged or not worth transporting. Kiln shells with drive and support stations, mills, and large fans are items that may be economical to transport and reassemble. When a cost is assigned to meet the challenges and risks mentioned above, the overall relocation project costs are generally higher than buying new equipment. However, there are always exceptions to the rule.

About the Author(s)

Francisco M. Benavides, P.E.

Mr. Benavides, Principal Consultant at PEC Consulting Group LLC, has many years of experience in project management, design and construction.  He has conducted bankable feasibility studies, economic analysis of mineral transport alternatives, plant valuations for acquisitions and for financing purposes, and due diligence studies.  He holds an MBA from Kellogg School of Management, Northwestern University, Evanston, Illinois; a Bachelor of Science and Professional Degree in Civil Engineering from the Missouri University of Science & Technology, Rolla, Missouri; and has completed Graduate Studies in Engineering Management and Environmental Engineering at Missouri University of Science & Technology.

Narayana Jayaraman

Mr. Jayaraman has over 48 years of experience in the cement industry with expertise in plant conceptualization, layout, various operating systems, process calculations, production optimization, and Waste Heat Recovery (WHR) based power projects for cement and lime plants. He has led several studies to estimate realistic waste heat for power generation. He has had in-depth exposure to the technical, economic, and commercial aspects of large cement projects, and extensive experience in the upgrade and optimization of existing plants. He earned a BS in Mechanical Engineering from Osmania University, Hyderabad, India, and an MS in Mechanical Engineering from the Indian Institute of Technology, Kharagpur, India.


PEC Consulting Group LLC | PENTA Engineering Corporation | St. Louis, Missouri, USA

How can we help you? Get in touch with our team of experts.

Root Cause Analysis

By Lucia Martinez

Simply stated, Root Cause Analysis, “RCA”, is a tool designed to help identify not only what and how an event occurred, but also why it happened. Until a determination is reached as to why an event or failure occurred, workable corrective measures that prevent future events from happening cannot be implemented. Identifying root causes is the key to preventing similar recurrences.

RCA is a four-step process: 

1. Data Collection

The first step in the analysis is to gather data. Without complete information and an understanding of the event, the causal factors and root causes associated with the event cannot be identified.

2. Causal Factor Charting

Causal factors are those contributors (human errors and component failures) that, if eliminated, would have either prevented the occurrence or reduced its severity. Causal factor charting provides a structure to organize and analyze the information gathered during the investigation and identify gaps and deficiencies in knowledge. The causal factor chart is simply a sequence diagram with logic tests that describes the events leading up to an occurrence, plus the conditions surrounding the events.

3. Root Cause Identification

After all the causal factors have been identified, root cause identification starts. This step involves the use of a decision diagram called the Root Cause Map to identify the underlying reason or reasons for each causal factor. 

The identification of root causes helps in determining the reasons the event occurred so the problems surrounding the occurrence can be addressed.

Figure 1. Root Cause Map

4. Recommendation, Generation, and Implementation

Following identification of the root causes for a particular causal factor, achievable recommendations for preventing its recurrence are generated. Understanding why an event occurred is the key to developing effective recommendations.

If the recommendations are not implemented, the effort expended in performing the analysis is wasted. Organizations need to ensure that recommendations are tracked to completion.

5. Example

Imagine a case when production stopped due to equipment malfunction. The equipment was relatively new and in good condition when the failure occurred. 

A typical investigation would probably conclude that operator error was the cause. However, to understand the reasons for the breakdown, a more in-depth analysis should be performed. 

In this case, we might ask, “Was the equipment really in good shape? Was the maintenance department doing its job? Was the operator familiar with the equipment?”

The answers to these and other questions will help determine why the breakdown took place and what measures should be taken to prevent a recurrence. For example, recommendations might include establishing a solid maintenance program or conducting training sessions for the operators.

The results of the analysis are usually presented in a Root Cause Summary Table, which organizes the information compiled during the steps mentioned before. Each column represents a major aspect of the RCA process.

    • In the first column, a general description of the causal factor is presented along with sufficient background information for the reader to be able to understand the need to address the causal factor.
    • The second column shows the Path or Paths through the Root Cause Map associated with the causal factor.
    • The third column presents recommendations to address each of the root causes identified.

The use of this three-column format shows root causes and recommendations developed for each causal factor.


Event description: equipment failure

Table 1. Root Cause Summary Table

Note. Adapted from Root Cause Analysis Handbook.

About the Author(s)

 This article was contributed by Lucia Martinez, Research Specialist for PEC Consulting.


PEC Consulting Group LLC | PENTA Engineering Corporation | St. Louis, Missouri, USA

How can we help you? Get in touch with our team of experts.

Limestone Sampling and Testing – Cement and Lime Mines

By Ken R. Schweigert

1. Homogeneous Geological Formations

Some limestone mines contain reserves that are massive, thick deposits with small variances in the chemistry of the limestone. Provided there are no complicated geologic structures within the deposit, the mine can rely heavily on the original core testing data to predict the quality of the limestone feeding the plant. Core holes can be widely spaced as long as the geology shows consistency in the reserve. Mine sampling and testing are performed to make sure the mine stays within the boundaries of the quality horizon or seam. 

To maintain quality of the limestone in these types of deposits, the following methods are used:

1.1. Typical Method in Open Pit Quarries 

    • A quarry rotary air drill is used to find either the top (hanging wall) or bottom (foot wall) of the deposit between core holes.
    • Samples are taken at intervals necessary to locate the quality by simply blowing out the chips at specific intervals and placing them in sample bags for testing.
    • This can be done in advance of final drilling and blasting to make sure enough overburden is removed or that the mine does not go too deep and below the foot wall.

1.2. Typical Method in Undeground Quarries 

In underground mining, the thickness of the quality seam will determine the number of lifts or layers that can be removed at one time:

    • For thicknesses of up to 10 meters, a single heading will remove all the limestone from the seam.
    • Thicker seams will require multiple lifts to remove all of the quality stone.
    • There may be a heading to remove the first layer followed by removal of the bench.
    • Sampling of the initial heading is usually done by taking samples of the top, middle and bottom of the mine face.This is performed after the heading is cleaned out and scaling has removed any loose stone from the top and face.
    • Bench sampling can be done using the same method as the open pit quarry using the rotary air drill chip samples. 

There could be a certain consistent tracer seam that is visible on the core holes and assists the mine personnel in finding the head and foot wall. A geologist should be able to point this out when he logs the core. Mine personnel will use this as a method to stay within the seam.

Plant sampling and testing of incoming limestone feed from a very consistent mine deposit can be limited to taking a sample during each shift, more for the record than to control the quality

2. Complex Geological Formations

Sedimentary deposits that are jumbled and faulted present difficult conditions for maintaining the quality of the limestone feed to the plant. Often these deposits contain anticlinal or synclinal folding; faulting; blocking; and, other geologic structures that make mining difficult. 

The more complicated the limestone structure, the more sampling and testing required to ensure the delivery of quality limestone to the process. In these conditions, the number of core holes will have to increase to define the areas of quality limestone and the geologic structures, and to determine the “mineability” of the deposit. 

These types of limestone deposits are normally only mined by open pit quarrying. Underground mining is usually too difficult to mine safely. Sampling in the pit becomes a significant part of the mining operation:

    • Not only are you looking for head and foot wall but also geologic structures that can cause contamination in the stone. For instance, in an anticlinal fold, the upper portion of the reserve is in tension and the bottom is in compression. The upper portion is prone to cracks and crevices that fill with contamination from the layers above. In faulting, the area displaced can contain similar contamination. If the deposit is broken up in blocks, additional testing will need to be done to determine the boundaries of the good limestone.
    • Sampling and testing in the mine will need to increase. Chip samples along with face samples will be used to locate the areas of good quality stone. Sometimes a geologist will need to visit the mine on a regular basis to assist the mine personnel in interpreting the location of quality stone.

2.1. Quality of the Limestone Feeding a Cement Plant

    • These types of limestone reserves require further testing at the cement plant prior to the raw material blending process.
    • Sampling and testing must be continuous to meet certain chemical requirements. Based upon the quality of the limestone delivered to the plant, high grade limestone, silica, alumina and iron are added to the mix to meet certain chemical properties for the formation of clinker in the kiln.
    • To ensure proper mixing, the mixture is conveyed to a specially designed homogenizing silo to further blend the raw meal prior to clinkerization.
    • Most cement plants blend raw materials using an on-line analyzer. The on-line analysis is imperative for the production of good quality clinker.

2.2. Quality of the Limestone Feeding a Lime Plant

    • In the process of converting high calcium limestone into calcium oxide in a lime kiln, the rule of thumb to follow is “the more complicated the deposit, the more sampling and testing is needed prior to the kiln”.
    • There is not a whole lot that can be done with the limestone once it is fed to the kiln.
    • Unlike cement, there is usually no blending system to improve the mix. An on-line analyzer may be employed to divert low quality limestone to waste in the crushing and screening area.

About the Author(s)

This article was contributed by Ken R. Schweigert, Senior Process Consultant at PEC Consulting, St. Louis, Missouri. 


PEC Consulting Group LLC | PENTA Engineering Corporation | St. Louis, Missouri, USA

How can we help you? Get in touch with our team of experts.

Plant Process Audits

By Narayana Jayaraman

A Plant Process Audit is a comprehensive evaluation of the overall performance of the plant’s operations. PEC Consulting systematically evaluates the plant’s operations, identifies the areas that are not working efficiently, and presents its findings and solutions to optimize the plant. The steps for plant process audits are as follows.

1. Benchmarking

Modern, dry-process cement plants with efficient configuration of grinding and pyroprocessing systems typically consume less than 700 kcal/kg-cl thermal energy and 100 kWh/mt of electrical energy. Older plants have inefficient systems, which compounded with operational and maintenance inadequacies, result in much higher energy consumption. Based on the plant’s conditions and specific requirements, general benchmarking is done to set targets. Plant audits evaluate the operation of a cement plant against the appropriate benchmark. After a detailed evaluation, recommendations for plant optimization are made in three levels of capital investment:

    • Step 1: None or very little capital investment — by making adjustments to the operational protocols and improving maintenance.
    • Step 2: Minor capital investments – with a payback within 24 months.
    • Step 3: Major capital investments – with a 3- to 5-year payback.

2. Historical Evaluation

The plant operational and stoppage data is collected over the past two or more years. The reasons for the stoppages are analyzed in terms of category (mechanical/electrical/instrumentation/refractory/other), duration, and frequency in order to identify causes in order of severity.

The plant performance is also analyzed by department. Often a department’s best performance does not occur at the same time of best performance of the plant as a whole. If we choose the best performance times of each department and make them occur at the same time, the plant performance would show a considerably higher level of efficiency. Attempts are made to make them happen at the same time, which is not an unrealistic target as the departments had indeed performed at that level in the past.

Through a systematic approach, all departments are made to perform at the highest possible level thus increasing the plant’s overall productivity.

3. Thermal Energy

Thermal energy relates to the Pyroprocessing system. For a 1 million mt/year clinker production, savings of 10 kcal/kg-cl would result in annual savings of approximately $185,000. 

(1,000,000 tpy*1,000 kg/y*10 kcal/yr * $120/t-coal)/ (6,500kcal/kg-coal/1,000 t coal) 

Another significant advantage in most cases is that the reduction in heat consumption can be utilized to increase production. Potential savings can also be derived from:

    • Cooler optimization.
    • Arresting in-leakages.
    • Optimization of operational strategy.

4. Electrical Energy

Large fans and mill drives are major consumers of electrical energy. 

    • Fans – fan power is linked to specific heat consumption and many operational parameters. Optimization of these parameters will help lowering fan power consumption. 
    • Mills – in the case of ball mills, optimization of the mill charge and upkeep of the mill internals will minimize power consumption. As for vertical roller mills, the inspection of mill internals and separator and adjustments in the operation will bring about improvements, both in energy consumption and production increase.

5. Chemistry and Operations Strategy

Clinker quality related issues are addressed by evaluating the chemistry and operational parameters.

6. Emissions Management

The inadequacy of emission management systems generally found in older plants does not meet current emission regulations. PEC Consulting can analyze emission levels and provide solutions to improve emission management. 

The expert staff at PEC Consulting Group has the capability to undertake Plant Process Audits and provide ongoing technical assistance to cement plants to improve operational performance. The scope of work generally includes: 

    • Plant visit and discussions with the plant’s operating personnel.
    • Data collection of historical stoppages and operating parameters.
    • Analysis of the data to identify areas for improvement.
    • Submission of a report providing observations and recommendations, including economic analysis to establish the cost/benefit ratios.
    • Develop an implementation program with the Plant Management.
    • Work with Operating personnel through periodic goal-setting and audits until the prescribed performance goals are achieved. 

A Plant Audit is the foundation to optimize the plant operations and often presents the lowest cost/benefit investment ratio.

About the Author(s)

Narayana Jayaraman

Mr. Jayaraman has over 48 years of experience in the cement industry with expertise in plant conceptualization, layout, various operating systems, process calculations, production optimization, and Waste Heat Recovery (WHR) based power projects for cement and lime plants. He has led several studies to estimate realistic waste heat for power generation. He has had in-depth exposure to the technical, economic, and commercial aspects of large cement projects, and extensive experience in the upgrade and optimization of existing plants. He earned a BS in Mechanical Engineering from Osmania University, Hyderabad, India, and an MS in Mechanical Engineering from the Indian Institute of Technology, Kharagpur, India.


PEC Consulting Group LLC | PENTA Engineering Corporation | St. Louis, Missouri, USA

How can we help you? Get in touch with our team of experts.

Benefits of Training

By Jagrut Upadhyay

Training imparts continuing education and brings the operators up to date in their skills to perform and respond more efficiently to emergencies. Training is essential for any organization, especially mineral processing industries, such as cement or lime plants, where continuous uninterrupted operations are key to the company’s profitability.

There is significant value to a company in training its employees. Increasing the knowledge of a particular job’s function enhances the employee’s understanding of a particular process / operation. And training lifts the morale of the operating personnel and raises their consciousness on technical issues. Operating personnel are usually eager to learn advanced techniques or new skills in order to perform their duties more effectively and keep themselves updated with industry developments.

Cement manufacturing is a complex process that calls for teamwork among the operators of the various units of a cement plant: Pre blending of various minerals, Drying and grinding, Homogenizing, Pre-heating and Calcining, Burning, Coal drying and grinding and Cement Grinding and Packing. The entire process also involves material handling and other mechanical operations which influence the process and eventually the operation of the plant.

It is important that people fully understand how their area of work relates to the total process. Training allows them to see the “Big Picture”.

During training the employees also benefit from learning recent trends in the industry and technological developments. It is an opportunity to interact with experienced personnel and experts and learn design considerations, effect of design parameters on the process and operation, etc.

The specific reasons and benefits of training are:

    • Continuous education.
    • Advanced techniques and new skills.
    • Stay competitive.
    • Enhance team work.
    • Improve quality and productivity.
    • Keep updated with industry developments.
    • Improvements in overall plant performance.

1. What Can PEC Consulting Do?

Training is imparted to make trainees understand the subject in a very simple manner. Simple language and to–the-point description make both training as well as the subject interesting.

Many encouraging results such as gain in production and equipment’s operational efficiencies, increased availability and reduced downtime, and enhanced equipment safety are true benefits of training. Organizational Benefits of training are listed as follows:

    • Improved and efficient work practices.
    • Stable, experienced, well-trained and highly skilled work force.
    • Reduced wastage of time and resources.
    • Improved plant efficiency parameters.
    • Motivated staff.
    • Increased satisfaction levels.
    • Enhanced equipment life.

2. Elements of Training

Imparting training involves the following elements:

    • Handouts and course materials.
    • Classroom training and group discussion.
    • On-field or in-plant training.

3. Handouts and Course Material

Handouts and Course material are a permanent reference and guide for the participants. They broadly include:

    • Explanation on details of the subject.
    • Engineering, Design and Safety features of the equipment and Process safety.
    • Operational aspects.
    • Theoretical and Calculation elements.

4. Classroom Training and Group Discussion

One-on-one and group discussions during classroom training help to better understand basic design criteria, fundamentals of various calculations, and how to make use of process parameters and information gathered to improve a given equipment’s performance.

Classroom training generally covers the following subjects:

    • Chemistry.
    • Basic chemical formulae and reactions.
    • Basic Calculations.
    • Manufacturing process.
    • Equipment – features and operation.
    • Plant operation.

Classroom training and group discussion also involves the following:

    • Delivering lectures and presentations.
    • Sharing Knowledge and Experience.
    • Discussion on critical aspects of plant operation.
    • Understanding the importance and inference of process parameters.
    • Analysis of process parameters.
    • Understanding Process control logics and Equipment Safety logics and their consequences.

5. On Field or In-Plant  Training

In-plant training is different from the classroom environment. On field or In-plant training provides an industrial exposure to new entrants. It enables the participants to acquire more practical knowledge of the equipment.

On field or In-plant Training provides distinct advantages:

    • Equipment inspection.
    • Information on “What to look for”.
    • Physical inspection provides information on equipment conditions.
    • Practical experience of process parameters measurements.
    • Enhanced accuracy of measurements.
    • Understanding the importance of maintenance and its effects on process parameters.

6. Summary

A small amount of capital spent on training may be viewed as an Investment on Human Capital rather than expenditure. In simple economic terms, a 1% increase in production through less downtime and increased productivity will result in additional cement availability of 10,000 t/year from a 1 million ton/year plant. Assuming a margin of USD 40 per ton, this will yield an increased profit of USD 2,000,000 per year through a small investment in training.

About the Author(s)

The main contributor to this Article was Jagrut Upadhyay, Process Consultant at PEC Consulting Group in St. Louis. Jagrut has a Bachelor of Science Degree in Chemical Engineering, from the D.D. Institute of Technology, Gujarat University, India.


PEC Consulting Group LLC | PENTA Engineering Corporation | St. Louis, Missouri, USA

How can we help you? Get in touch with our team of experts.

Mineral Exploration: Prospectivity

By José I. Escavy

The first step in exploring for any mineral resource is to determine the area where the exploration will take place. The selection of the best area will increase the probability of finding a deposit. Mineral prospectivity is a predictive tool used in choosing the location for the exploration efforts. Mineral prospectivity is broadly used in the early stages of the exploration of metallic ores and industrial minerals and rocks (magnesite, fluorite, clay, graphite, etc.). It minimizes the technical and financial risks associated with decision making in mineral exploration. Depending on the quantity and quality of information available, there are two predictive modeling approaches that can be applied:

    1. A data-driven (quantitative) study if the quantity and quality of information is high.
    2. A knowledge-driven modeling (qualitative) if the information is scarce or unreliable, which focuses in the geological processes generating the desired ore type in a qualitative manner.

Geographical information systems (GIS) provide the framework to integrate the relevant exploration parameters for the targeted mineralization occurrence, such as geology, geochemistry, geophysics, land use, etc. (see Figure 1), processed by spatial data analysis techniques (weights of evidence, logistic regression, fuzzy logic, location–allocation, etc.). The results obtained from the prospectivity study are usually presented as a predictive map where, over a usually broad area (country, region, etc), the areas with a higher occurrence probability for a certain mineral are highlighted. These maps are used by the exploration team to define the areas to look in detail.

Figure 1. Geographical Information Systems

For those mineral resources that are abundant, broadly distributed, and with a low unitary price (high place-value mineral commodities) like aggregates, limestone, gypsum, etc., transport costs (proportional to distance) are a key factor to be taken into account and therefore market parameters should be integrated in the GIS together with the rest of relevant information. By integrating the location of consumption points (demand), location of concurrent facilities (existing offer), and transport networks (roads, railway lines, etc.), prospectivity studies will determine the most favorable areas in term of market-capture (see Figure 2), prioritizing the areas to be investigated depending not only on the geological availability but also on market parameters. This technique can be applied for all those mineral resources where the transport costs have a high impact in the final price of the product like building materials, gypsum, frac sand, etc.

Figure 2. Favorable Areas of Market Capture

 A prospectivity study is an inexpensive and powerful tool that efficiently allocates the exploration resources, increasing the probability of findings, reducing the inherent risks associated to mineral resources exploration, or finding the best place, in terms of market, to locate a new mining facility.

About the Author(s)

Jose I. Escavy, PhD

Dr. José Ignacio Escavy has over 20 years of experience in mining of industrial minerals. He has hands-on experience in exploration, investigation, deposits modeling, reserves calculation, mine planning, reclamation, and closure of quarries. He has served as Manager of the Quality and Environmental Department and Quarries Manager of large cement production facilities. Dr. Escavy has been a presenter at many international conferences and publisher of scientific and technical publications on evaluation and design of mining deposits. He is fluent in Spanish, English, and French. His credentials include a Degree in Geology from the University of Madrid, Spain (5-year program); M. Sc. in Minerals Resources from the University of Cardiff, U.K.; Ph.D. in Industrial Minerals from the University of Madrid, Spain; and, Geological Research Accreditation, University of Madrid, Spain.


PEC Consulting Group LLC | PENTA Engineering Corporation | St. Louis, Missouri, USA

How can we help you? Get in touch with our team of experts.

Market Research

By Lucia Martínez

Understanding the market landscape is one of the most important prerequisites in strategic decision-making. More often than not, the key to competing and outperforming competitors lies in a better understanding of the key growth areas and market trends. A rigorous market study helps to support strategy development by providing valuable insights on:

    • Industry structure and trends.
    • Market segments, size and growth potential.
    • Demand driver dynamics and their implications.
    • Competitive landscape – customers, competitors, suppliers.
    • Service, product differentiation and branding.
    • Market entry modes.

A good market analysis comprises at least 5 important parts.

Figure 1. Market Analysis

Part 1: Objectives of the Research

The researcher has to provide the rationale for undertaking the study. The tasks associated are:

    • Scope of work.

e.g., prepare for new product introduction, evaluate competitors, look for new market opportunities, etc.

    • Application of the information obtained in the Market Study.

e.g., support a marketing plan, measure and evaluate previous marketing decision, competitive research program, etc.

Part 2: Description of the Market

    • General Description.

A summary of the market being studied.

    • Target Market(s).

Geographic areas selected for analysis.

Population analyzed (e.g., demographics, psychographics, behaviors).

Benefits seeked (i.e., what points-of-pain or problems are being solved).

Factors affecting purchase or use decision.

Attitudes about the products/services currently offered.

Product use.

    • Products and Services that appeal to the target market.

In general terms (not particular brands) what is currently appealing to this market.

What types of products/services may appeal to this market (i.e., what is used now to solve the problem).

Part 3: Market Metrics

    • Size estimates (current and future) for:
      • Overall market.

Current size.

Potential size.

Actual penetration of current products/service within the total market.

      • Individual market segments.

Current size.

Potential size.

Actual penetration of current products/service within the total market.

    • Growth estimates (current and future) for:

Overall market.

Individual market segments.

Relation to GDP growth.

Part 4: Competitive Analysis

    • Summary of Current Competitors.

Listing by market share ranking (by each target market if possible).

    • Current Competitors – full analysis of top competitors including:

Products & Services (e.g., description, uniqueness, pricing, etc.).

Market share.

Current customers.

Positioning and promotion strategies.

Partnerships/Alliances/Distributors.

Recent news.

It is extremely important to focus attention on the SWOT section of this report. While most other information in this report can be gleaned from company and secondary materials, much of what appears in the SWOT section is based on the researcher’s own perceptions of the competitor based on the information collected. Consequently, this is often one of the hardest areas of the report to write.

SWOT Analysis – Strengths, Weaknesses, Opportunities & Threats.

And other information (as: general company information, summary of business, business overview, recent news/developments, financial and market share analysis, marketing, and other issues like technology capability or partnership arrangements).

    • Potential Competitors.

Explanation (though not as detailed as Current Competitors) on who they are or maybe and why they are seen as potential competitors.

Part 5: Additional Information

This section of the market study includes other information including:

    • Extraneous Variables.

Discuss factors that may affect this market (e.g., technological, social, governmental, competitive, etc.).

    • Market Trends.

What is expected to happen.

About the Author(s)

This article was contributed by Lucia Martínez, Research Assistant at PEC Consulting Group.

PEC Consulting Group LLC | PENTA Engineering Corporation | St. Louis, Missouri, USA

How can we help you? Get in touch with our team of experts.

Case Study: Design Modifications to A Lime Plant Using 3-D Scanning Technology

By Ken Schweigert

An existing plant has several old technology long rotary kilns. The client wanted to convert one of the kilns to a preheater kiln by shortening the kiln; building the preheater over the top of the kiln; new ductwork; baghouse and draft fan. There are multiple structures and equipment around the kiln, making the installation very complicated.

The “as built” drawings for the plant are decades old and several modifications to the plant have been done over the years. As is normally the case, the client did not update the drawings when modifications were made.

There is great potential for errors with field dimensioning in an existing plant that could lead to inaccurate design and subsequently additional installation costs. The alternative is to use 3D Scanning, which will greatly enhance the accuracy of the design and reduce construction costs, less potential for interferences and better planning of the installation.

To avoid these problems, 3D Scanning was used to obtain existing structural and equipment layouts.

    • A 3D Scanner takes over 900,000 points per second with an accuracy of 2mm in 50 feet. At the same time, it photographs the surroundings to add color to the scan and provides a panoramic view from the scan location.
    • Multiple scans were taken of the area where the new equipment and structures were to be installed and stitched together creating a point cloud where all the data was stored.
    • This way, a complete replica of the plant was used for the design.
    • Interfaces were checked and interferences detected and corrected. The potential for error was greatly minimized.

The full effect of 3D Scanning was realized during the construction phase:

    • There were far less interferences in the field leading to lower construction costs.
    • The scan also picked up electrical cable tray, conduits, compressed air lines, water lines, gas lines and other items that had been added to the plant over the years.
    • Location and dimensioning of these items allowed the construction team to plan for the installation reducing site costs.

3D Scanning simplifies the measurement process and greatly increases accuracy which translates into cost savings.

About the Author(s)

The main contributor to this article was Ken Schweigert, Senior Process Consultant at PEC Consulting Group.


PEC Consulting Group LLC | PENTA Engineering Corporation | St. Louis, Missouri, USA

How can we help you? Get in touch with our team of experts.

Optimization of Industrial Plant Structures

By Ney S. Linares

The goal of optimizing a structure is to find the most efficient option using reliable methods. Decisions are based on the quantities of materials determined for each option. 

In order to identify options and to be as objective as possible, a chart is created with a set of apparent design options and the criteria influencing each of the options. The criteria influencing each of these options refer to an importance factor unique to the project under evaluation. From this chart, a set of allowable solutions is chosen. 

The following are variables to be taken into consideration while optimizing a structure:

Table 1. Variables & Alternatives to Consider When Optimizing a Structure

Figure 1. Cement Plant Pre-heater Tower Concrete/Steel vs. Steel

There are many variables in considering an optimal structural system. An optimization study can result in significant project cost savings and schedule optimization.

Figure 2. Mill Building Concrete vs. Steel

About the Author(s)

Ney S. Linares, P.E.

Mr. Linares is a Senior Structural Consultant at PEC Consulting Group. Ney has an M.S. in Structural Engineering and B.Sc in Civil Engineering from Washington University, Saint Louis, MO, and a B.S. in Physics from Bethany College, Bethany, WV. He is also a member of the American Society of Civil Engineers.


PEC Consulting Group LLC | PENTA Engineering Corporation | St. Louis, Missouri, USA

How can we help you? Get in touch with our team of experts.

Security of Your Coal Supply

By Len Dolby

Of the coal transported in the United States in 2013, approximately 92% was comprised of thermal coal used for electric power generation. The remainder was transported for industrial use or coke production.

Table 1. Methods of Transportation for Coal – USA – 2013

The performance of transportation systems are affected by many factors. Depending on the severity and duration of these issues, a point could be reached where the carrier is not able to recover and deliver the agreed upon tonnage for the year, which presents a real challenge to maintaining coal inventories at desired levels. Some common issues faced by carriers include:

Table 2. Common Issues Faced by Carriers

Issues Affecting Carriers in 2014

During the first half of 2014, several issues have impacted carriers, such as:

    • A harsh winter rendering the shipping lanes on the Great Lakes impassable longer than normal.
    • Flooding conditions along various sections of railway lines and highways.
    • High water conditions on the Ohio and Mississippi Rivers.
    • Poor rail performance out of the Powder River Basin due to a variety of reasons.

A number of users witnessed the depletion of the stockpiles, a few were eventually forced to reduce or curtail operations. Some had to resort to emergency measures by purchasing and transporting coal from other suppliers or from competitors likely at much higher, distressed pricing. Many coal users are still operating well below planned inventory levels as they near the completion of Q3 2014.

Major Future Concerns

Looking forward, the above issues and disruptions will continue on occasion. However, the biggest concern facing the nation’s coal transportation is the reliability of the aging lock and dam systems. Lock and dam outages have a significant impact on shipping. An example is Lock 27, the southernmost lock on the Mississippi River, which was closed for emergency repairs in September 2012 after a barge crashed into the auxiliary canal (main canal was under repairs). The impact of the stalled barge traffic was estimated at $2.7 million per day. Lock 27, with new doors, began operations approximately five months later. The majority of the lock and dam systems were installed in the 1930s with a design life of 50 years and since they have not been replaced or overhauled as required. Currently, many of the locks and dams are in dire need of major repairs or overhauls. Current funding is not adequate. Funding is collected from a $0.20/gallon diesel fuel tax (paid by the barge lines) with a matching contribution provided by the Army Corps of Engineers.

Questions to Ask Yourself

    • How sensitive is your operation to fluctuations in inventory level?
    • Do you have the option of alternative fuels or transportation methods?
    • How would an unplanned disruption of supply impact your operations?
    • Are there new innovative solutions that may provide more flexibility to your coal supply system in case of an emergency?

Table 3. Key Points

PEC Consulting has evaluated and advised many clients on material handling and supply issues. Our diverse industry experience and knowledge of the latest systems allow us to identify risks and present solutions to our clients. We have developed unique material handling systems which can be easily installed and relocated. In many cases, we can recommend systems employing used equipment to reduce costs. PEC Consulting can review your supply system and present reasonable and real world options to improve your security of supply.  

About the Author(s)

The main contributor to this article was Len Dolby, P.E., Senior Mining Consultant at PEC Consulting Group, Saint Louis, MO. 


PEC Consulting Group LLC | PENTA Engineering Corporation | St. Louis, Missouri, USA

How can we help you? Get in touch with our team of experts.